Countries and companies have made a series of pledges to decarbonize over the past decade, but action has not followed suit.
This COP31 edition of the Institute’s Transition Finance Tracker examines the loop between government policy and corporate action. The report shows in 17+ charts how the economics of the transition to a cleaner, more resilient global economy vary across industries and technologies, and how corporate readiness relate to policy pressure. We also examine the rising cost of physical climate risk and the price of inaction for companies and economies.
Here are five highlights from the report:
Clean-energy stocks have outperformed oil and gas since the Paris Agreement
Clean-energy infrastructure nearly quadrupled in value over the 10 years ended Sept. 30, 2026, compared with a more than doubling for oil and gas producers. The relative performance varied substantially, however, depending on the starting point..
The starting point matters. An investor who bought at the end of 2020 would have gained 33% in clean energy and 216% in oil and gas by September 2026. Disruptions to oil and gas supplies from the wars in Ukraine and the Middle East helped boost energy prices and company profits.
Returns from clean-energy infrastructure companies, oil and gas producers and global equities
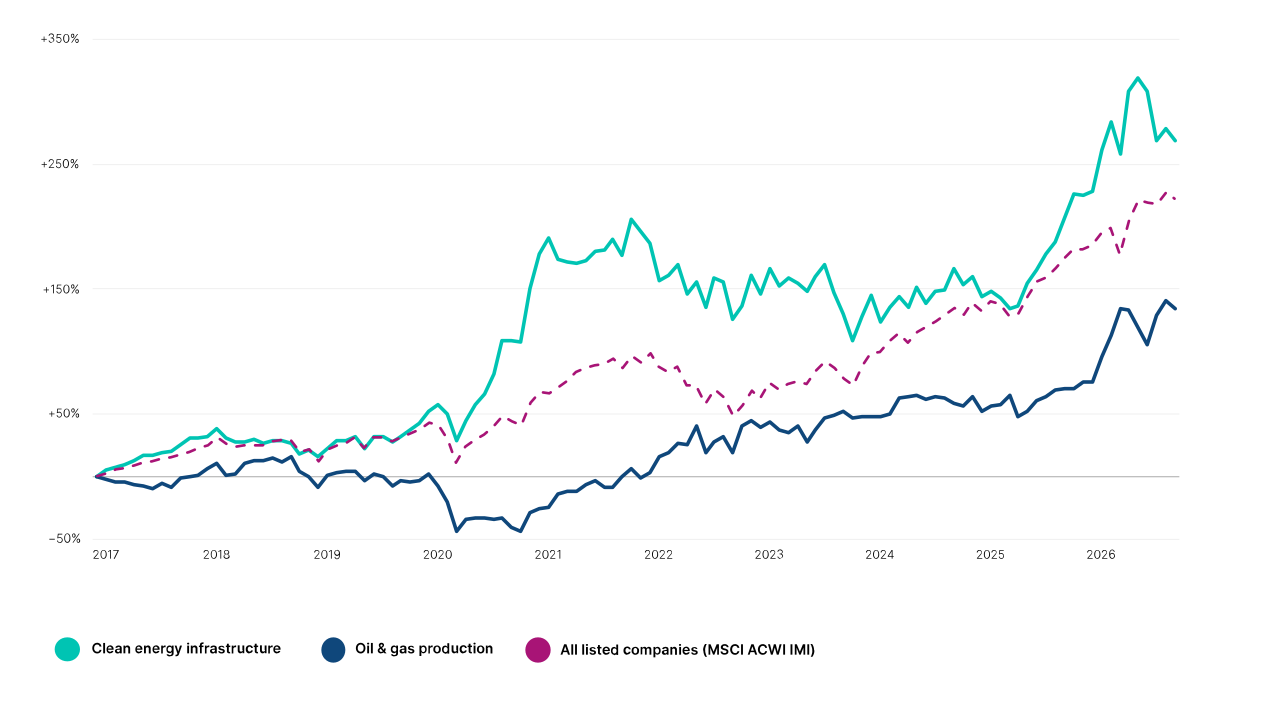
Source: MSCI Institute analysis based on MSCI index data through Sept. 30, 2026, and the International Energy Agency’s World Energy Investment 2025 and World Energy Investment 2026. Returns are month-end gross total returns in USD from end-December 2016 and reflect changes in company valuations. Clean-energy infrastructure = MSCI ACWI IMI Clean Energy Infrastructure Index; oil and gas producers = MSCI ACWI IMI Energy Index, which also includes energy equipment and services, refining and coal; global listed equities = MSCI ACWI IMI Index. Tesla Inc. has a significant weight in the Clean Energy Infrastructure Index; on an equal-weighted basis, the index would have underperformed the Energy Index from end-2024 through September 2026 but would still have outperformed the Energy Index across the full period. The Energy Index includes listed state-controlled companies. IEA data informs estimates of institutional ownership of listed state-owned energy companies. The MSCI ACWI IMI Clean Energy Infrastructure Index was launched on Dec. 2, 2021. Data prior to the launch date is back-tested, reflecting how the index might have performed had it existed during that period.
Policy, not pledges, moves emissions
Across G20 markets, higher pressure from national policies is associated with steeper emissions declines from 2022 to 2024, while heavier fossil-fuel subsidies accompany rising emissions. Corporate readiness follows, with exceptions. The five markets with very high policy pressure include France, the U.K. and Germany, which have among the highest median company readiness, but also Canada and South Korea, where median readiness is substantially lower. Transition readiness reflects companies’ strategy and governance, emissions targets and performance, and exposure to low-carbon solutions.
Company readiness by country of domicile
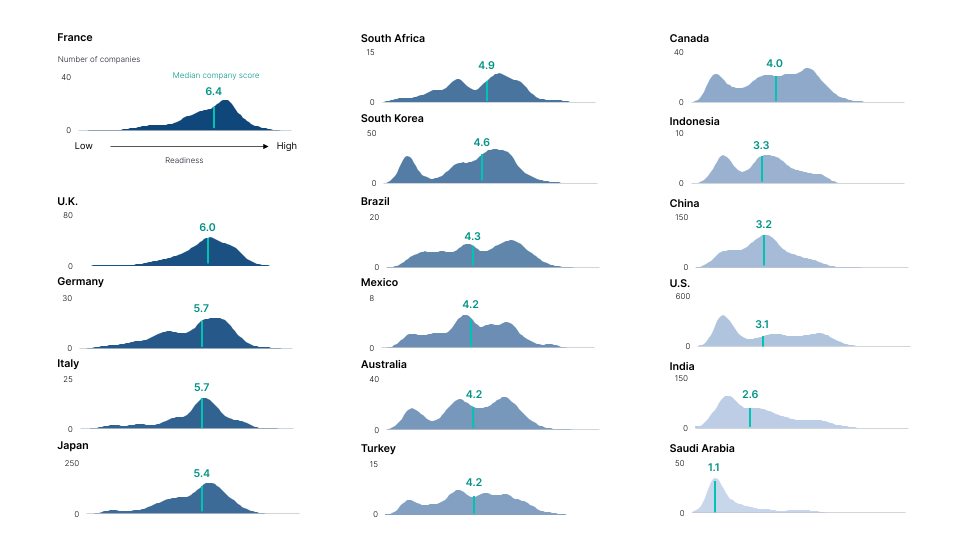
Source: MSCI Sustainability & Climate Research, based on the MSCI Energy Transition Framework, as of Sept. 30, 2026. Analysis covers 5,820 companies with an aggregate transition readiness score (0-10), grouped by country of domicile; Argentina and Russia are excluded because of unavailable data. Transition readiness is assessed using a rules-based methodology that combines strategy and governance, emissions targets, emissions performance and exposure to transition solutions. See the MSCI Energy Transition Framework for methodology details. Curves show the number of companies in each half-point score band, smoothed using a Gaussian kernel; each panel has its own vertical scale. Teal lines and labels indicate median company scores. Results are not adjusted for sector mix.
Cost-competitive solutions hold potential to address most power emissions
Solar and wind could address about 91% of listed power producers’ operational emissions at competitive cost, against about 25% of cement emissions and 19% of steel. Climate TRACE estimates that the top strategies could cut annual global emissions by roughly one-third, with 65% of that potential in the top 10 countries. The opportunity is large but concentrated by sector and by country.
Emissions, by cost competitiveness of lower carbon technologies
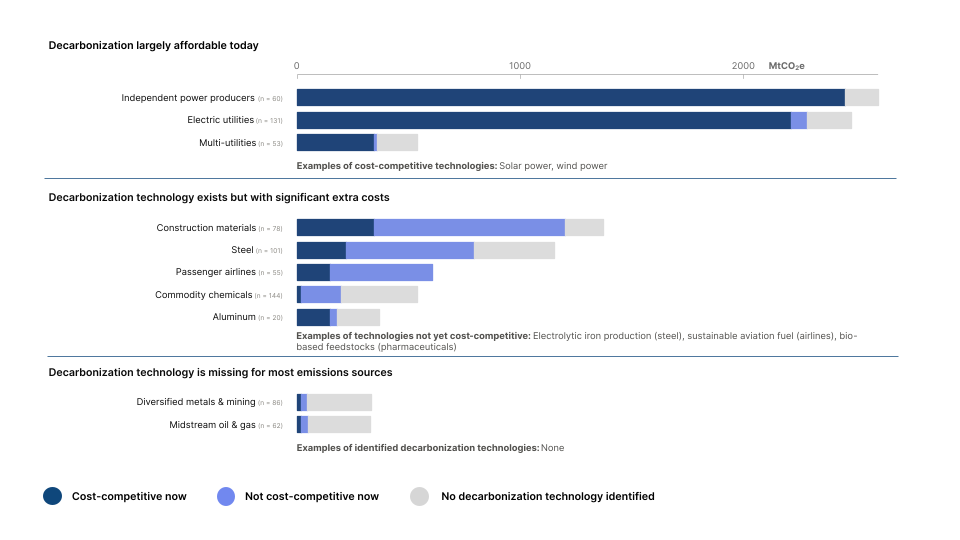
Source: MSCI Sustainability & Climate Research, based on MSCI Energy Transition Framework Technology Assessment data as of Sept. 30, 2026. Analysis covers Scope 1+2 operational emissions of 790 listed companies across sub-industries represented by the Global Industry Classification Standard (GICS®) jointly developed by MSCI and S&P Dow Jones Indices. Cost-competitive technologies are those at cost parity with incumbent technologies today; other technologies are expected to reach parity within five years or later. Residual emissions are those not addressed by technologies covered in the assessment. Potential emissions that can be reduced combine technologies across process steps and are capped at 100% of emissions. Results represent an illustrative ceiling, not a forecast.
Preparedness pays, and pays most where policy pushes
Companies in the top fifth for transition readiness outperformed the bottom fifth by about 25 percentage points over the five years to April 2026, widening to about 30 points when policy pressure was incorporated.
Return gap between companies with higher and lower transition readiness
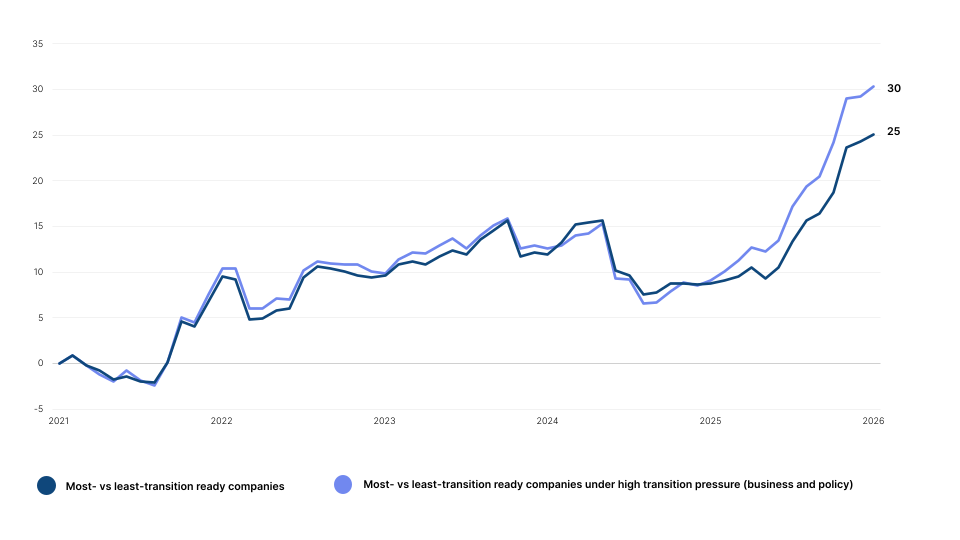
Source: “Managing the Energy Transition in Equities,” MSCI Research Insights, September 2026. Analysis covers listed companies in the MSCI ACWI IMI Index. Lines show the cumulative return spread between the top and bottom fifths of companies, equal-weighted within region and sector and measured in local currency.
Inaction already has a price
Heat-related labor-productivity losses equal about 2% of global economic output under current conditions, with Asia-Pacific most affected. Physical risk is also raising insurance costs, with cost pressure particularly elevated across parts of the U.S., eastern China, northern Australia and Argentina, plus localized hotspots in Europe.
Heat-related productivity losses by sector and market
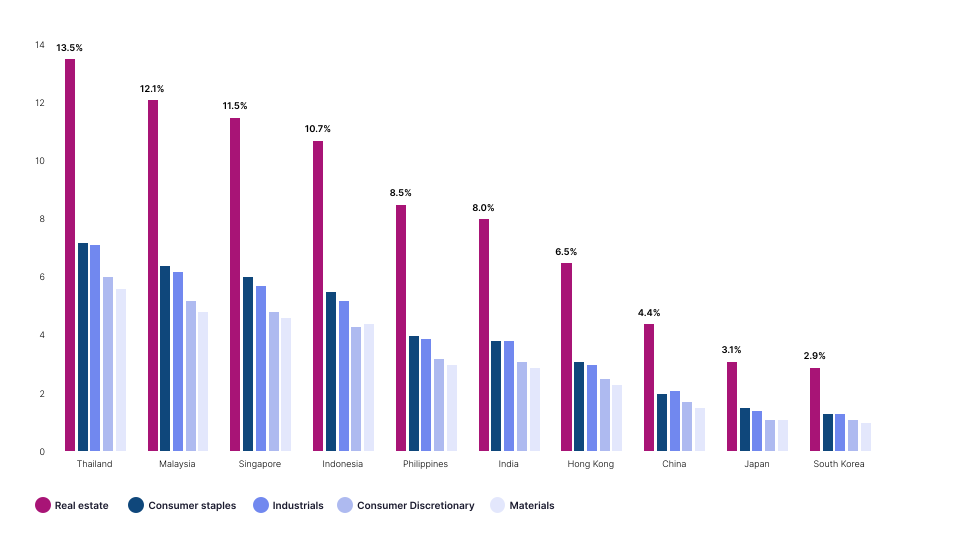
Source: MSCI Sustainability & Climate Research, based on First Street data as of September 2026. Analysis covers the 10 markets in the MSCI ACWI IMI in Asia with the highest estimated heat-related productivity losses relative to GDP. Losses are modeled under current climate conditions and reflect the estimated reduction in labor productivity attributable to extreme heat.