Just how big are the world’s largest companies? Which markets have delivered the best long-term returns? How big are private markets compared with public markets?
These are among questions answered in the inaugural edition of the Institute’s Global Investment Tracker, which we’ve developed for leaders in business, policy and finance whose decisions depend on and influence the flow and cost of capital.
As its title suggests, the tracker offers a global perspective, drawing on 30 years of MSCI data and indexes across public and private markets to show how they have evolved alongside each other and how the geography and sectors of global equity have rewired themselves over three decades.
Among highlights from the tracker’s 20+ charts and analysis:
Just how big are the world’s largest companies?
NVIDIA alone is worth more than the listed equities of any market outside the U.S. and Japan, based on data as of April 30, 2026.
Market capitalization (USD trillions)
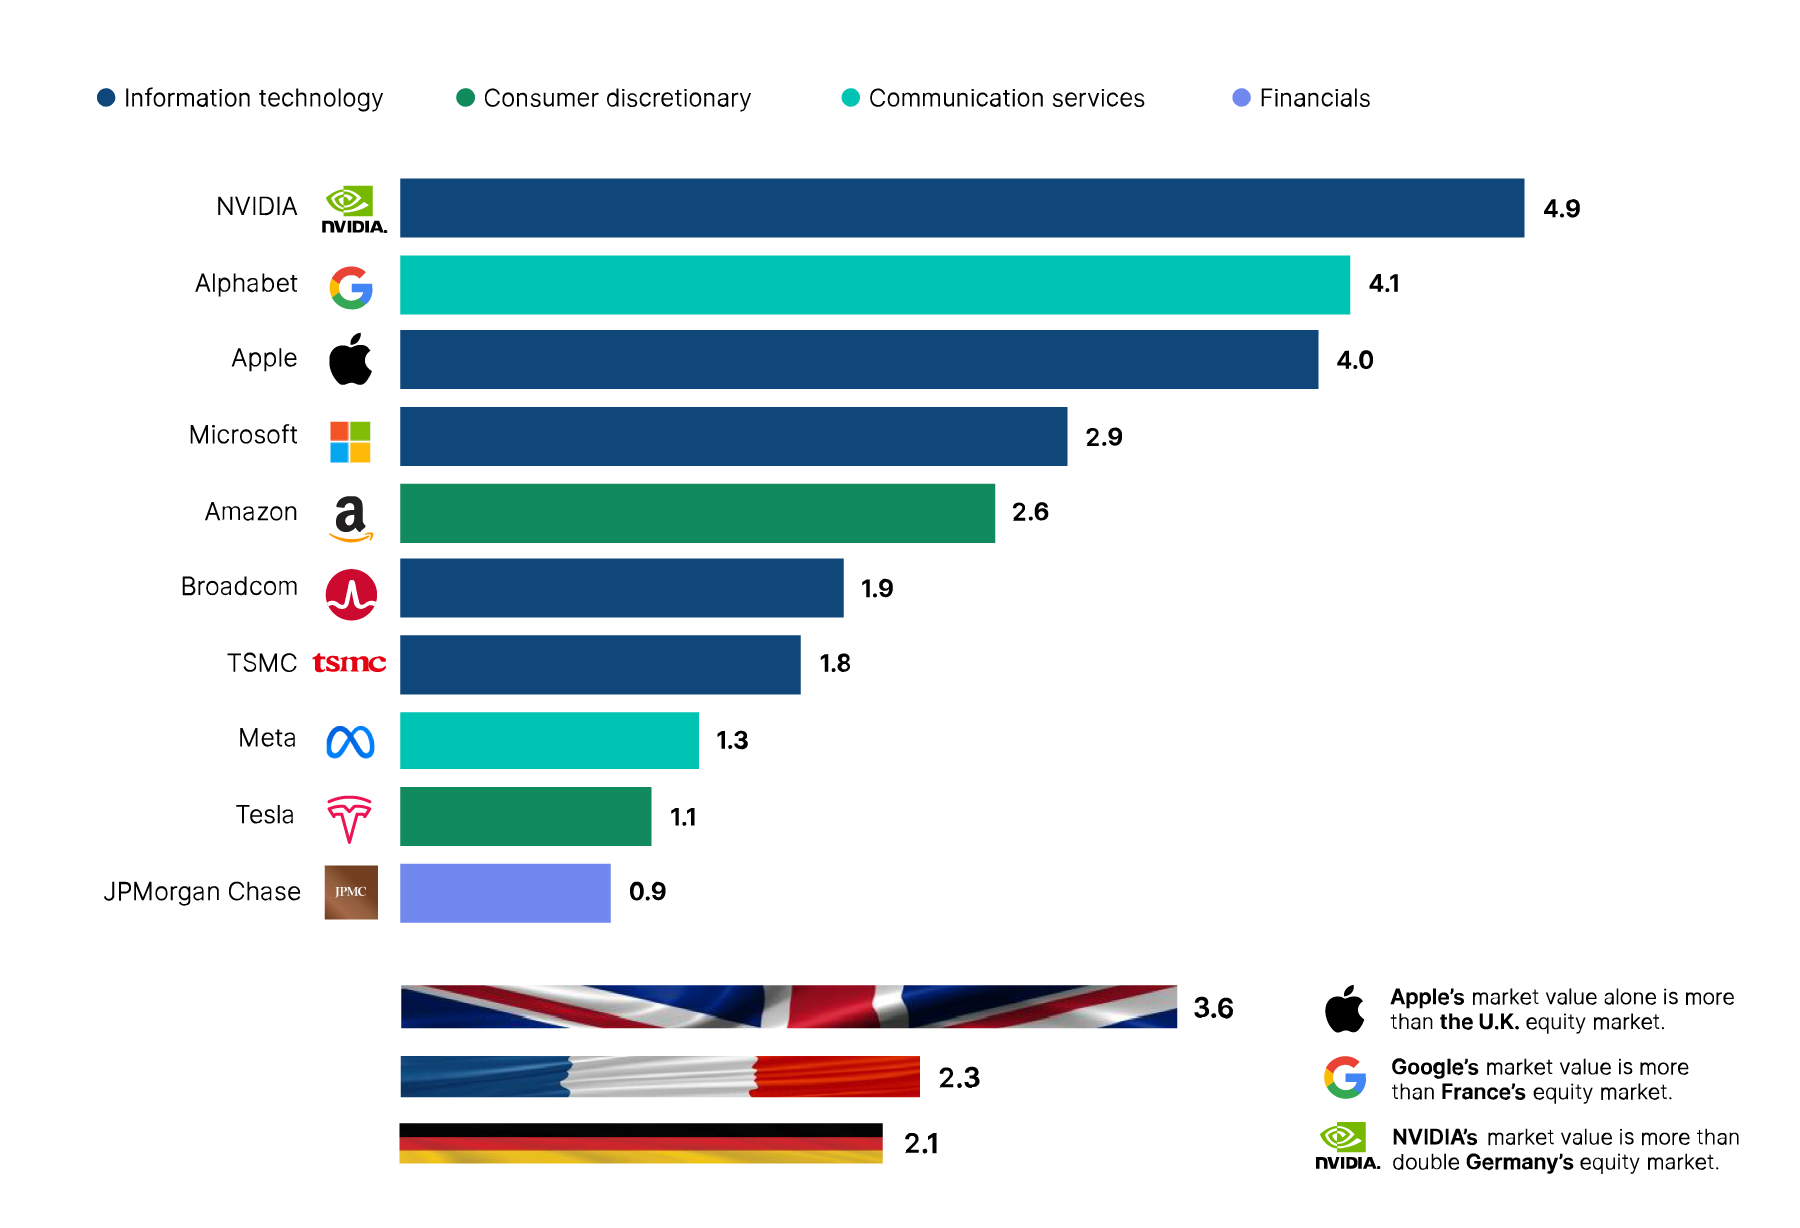
Source: MSCI Institute, based on the largest constituents of the MSCI ACWI IMI Index, and free-float market capitalization of companies. Data as April 30, 2026.
How big are public and private markets?
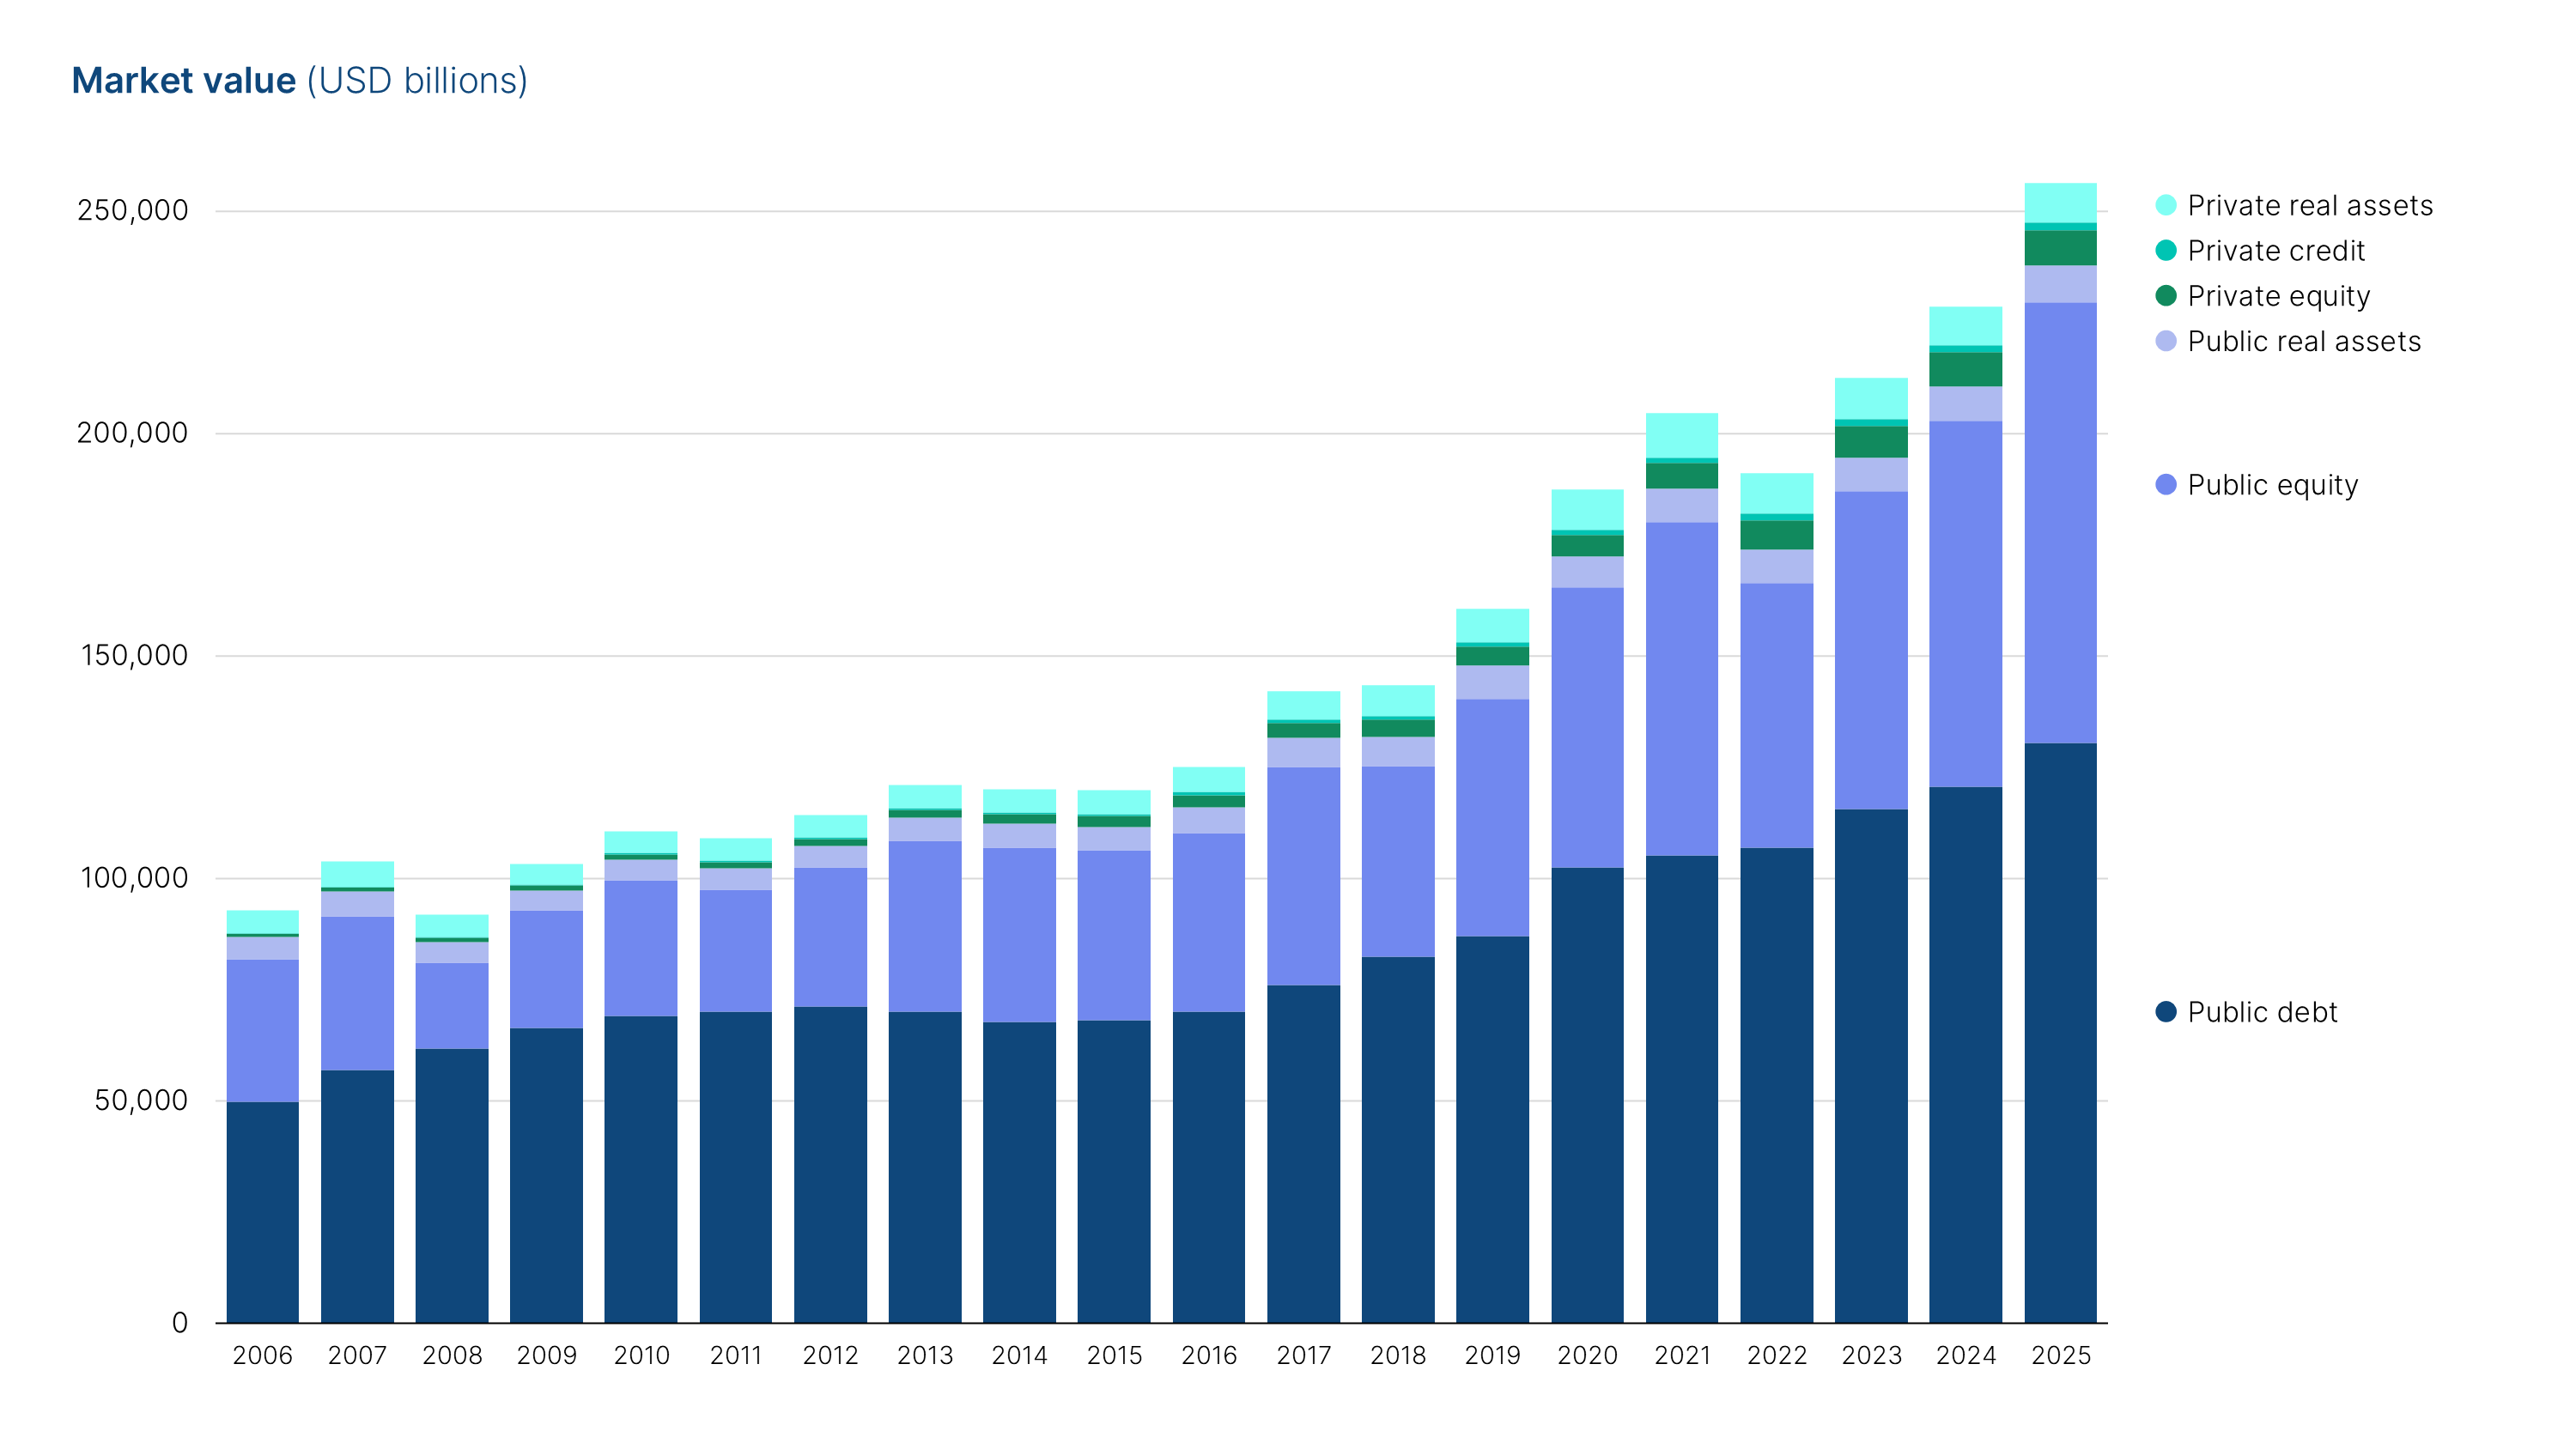
Private markets have grown dramatically over the past two decades — private equity expanded nearly elevenvold and private credit expanded even faster. Both are still dwarfed by public debt (USD 130 trillion) and public equity (USD 99 trillion).
Market value (USD billions)
Source: MSCI Institute. Public equity data as of Dec. 31, 2025. Fixed income data as of Jun. 30, 2025. Listed and unlisted real asset data as of Dec. 31, 2024. Private equity and private credit data as of Dec. 31, 2025.
Which markets dominate equity investing globally?
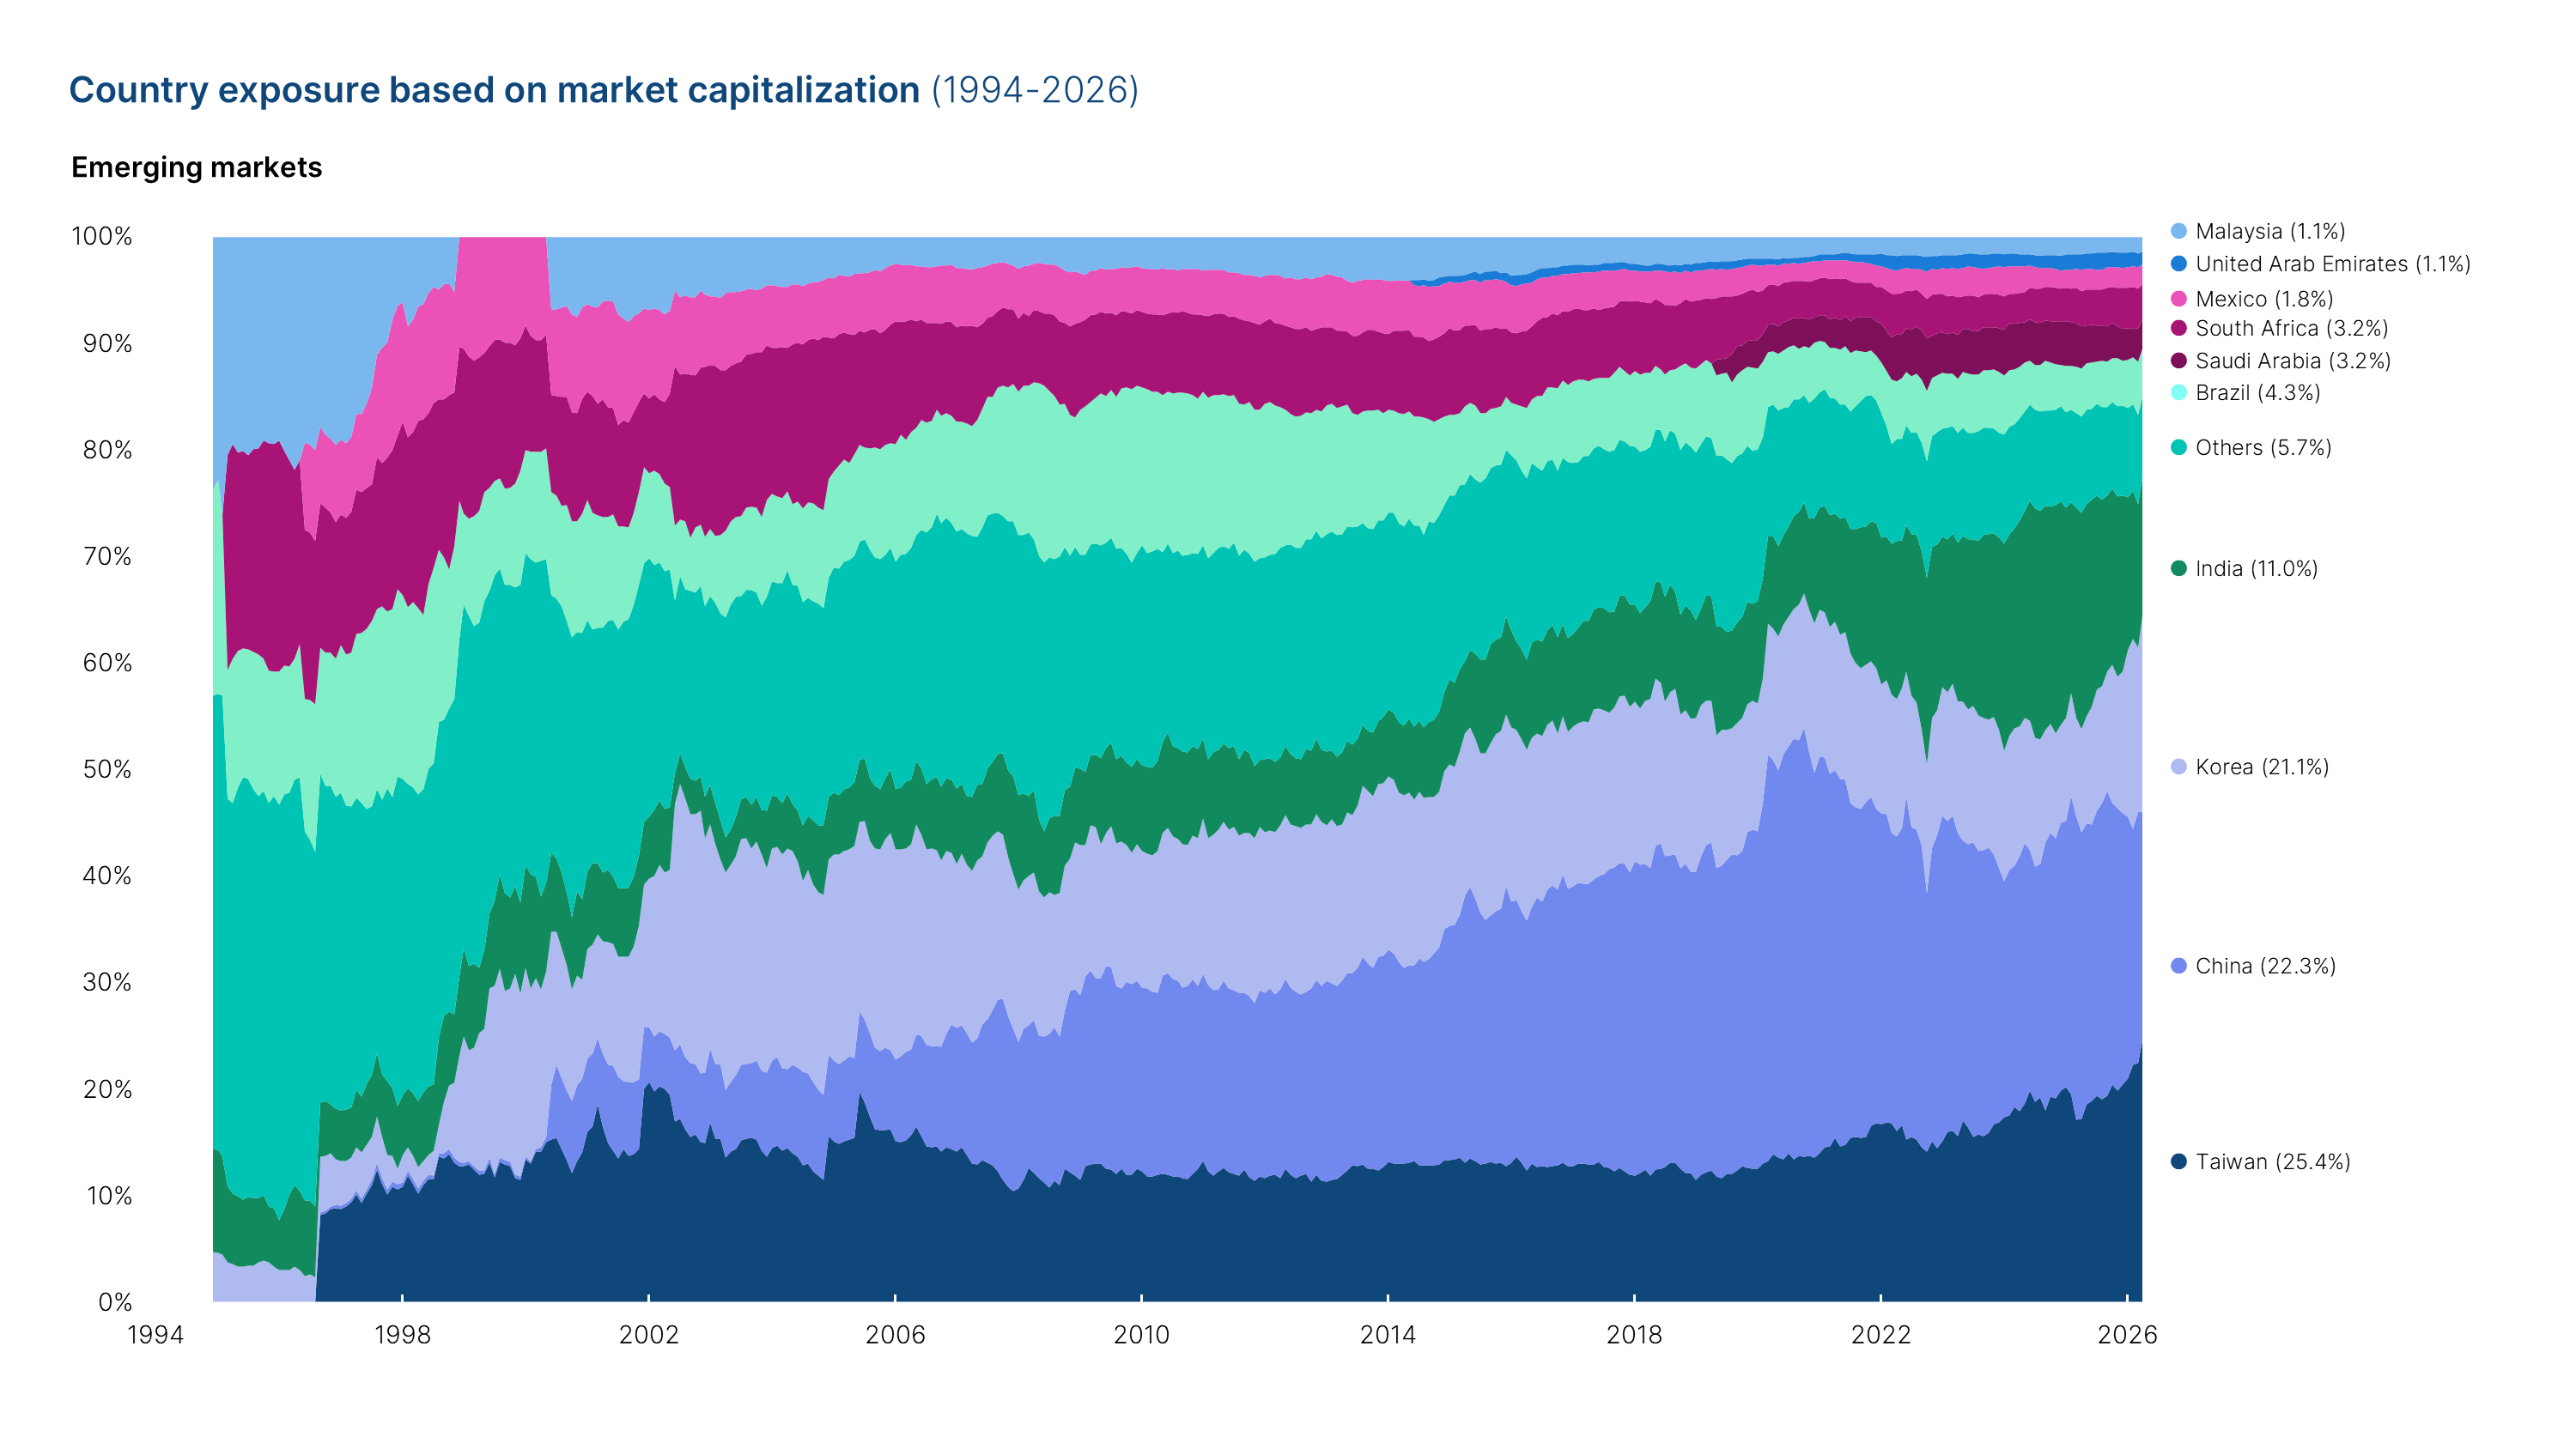
The U.S. now represents 71% of developed-market equity, up from roughly 40% in the mid-1990s. Taiwan (home to TSMC) has recently overtaken China as the largest emerging market by value, with South Korea (home to Samsung) also rising fast — reflecting how heavily emerging-market exposure now leans on a handful of Asian technology companies.
Exposure based on market capitalization (1994-2026)
Developed markets
Source: MSCI Index Research, data as of April 30, 2026. Developed-market weights based on the MSCI World IMI Index, including large, mid and small cap. Data from December 1994 to April 2026.
Emerging markets
Source: MSCI Index Research, data as of April 30, 2026. Emerging-market weights based on the MSCI Emerging Markets IMI Index, including large, mid and small cap. Data from December 1994 to April 2026.
The tracker invites readers to look beyond the shocks that define global markets daily to consider what the longer arc of how we arrived here might suggest about where capital could flow next.