How have climate funds performed?
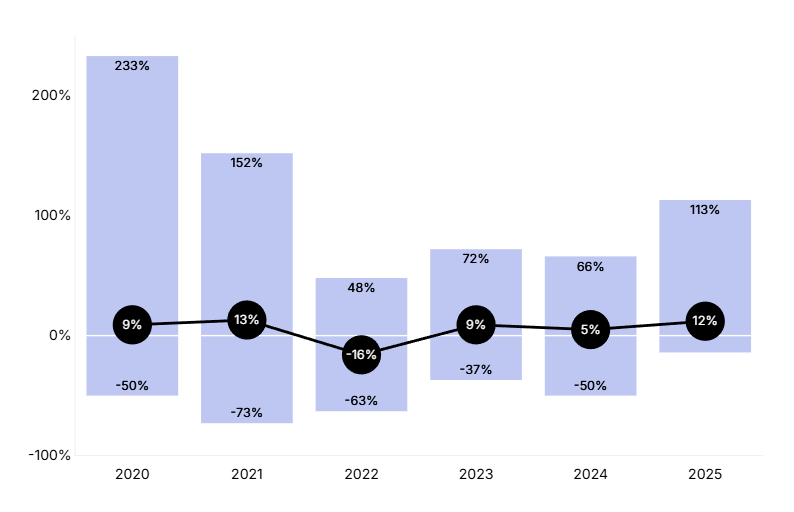
- Listed climate-themed funds posted a median return of 10% year to date through Sept. 30, 2026.
- Total assets reached USD 758 billion in the second quarter, up 16.3% since the start of the year. Most of the increase (88%) came from gains in the value of existing investments, while the remainder reflected new money flowing into the funds. Returns were strongest among funds focused on energy-transition technologies, as investors favored companies building clean-energy infrastructure and related technologies.
- In addition to the listed universe, there were about 212 climate-themed private-capital funds globally, with combined capitalization of about USD 176 billion as of June 30, 2026.
Publicly traded climate funds (distribution of calendar year returns)
Source: MSCI Sustainability & Climate Research and MSCI Private Capital Universe. Public funds data as of March 31, 2026. Public funds include equity, fixed income, and multi-asset ETFs and mutual funds. Private funds include private equity, private credit, and private real assets funds.
Capital in climate funds (USD billion)
Public climate funds (cumulative capital raised)
Source: MSCI Sustainability & Climate Research, data as of September 30, 2026.
Private climate funds (cumulative capital raised)
Source: MSCI Private Capital Universe, data as of June 30, 2026. Private funds include private equity, private credit and private real-assets funds.
What percentage of companies have set climate targets?
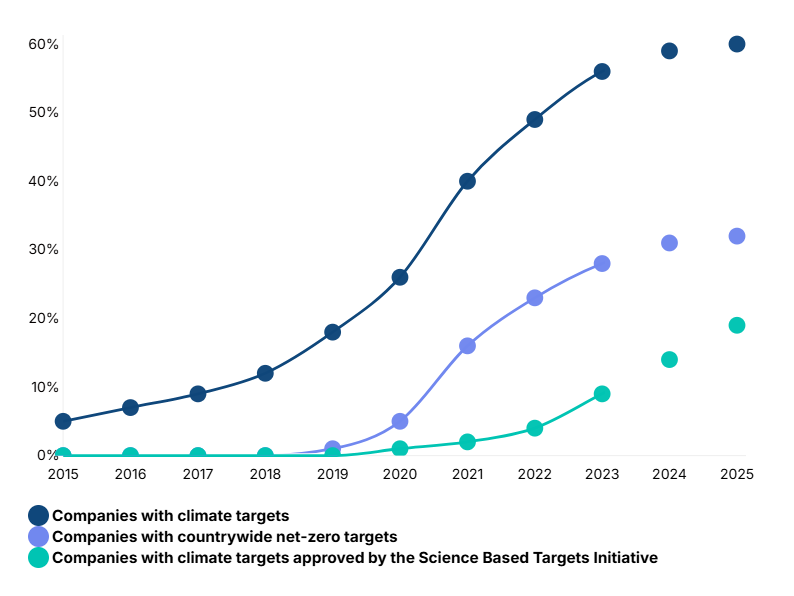
- Just over one-fifth (21%) of listed companies had a climate target validated by the Science Based Targets initiative (SBTi) as of Sept. 30, 2026, up from 19% a year earlier. SBTi-approved targets are widely regarded as a mark of credibility because the initiative assesses whether targets align with climate science.
- Both the ambition and rigor of corporate targets vary widely. More than a third (37%) of companies have set a net-zero emissions target, though not necessarily one validated by the SBTi, roughly unchanged from a year earlier. Overall, 64% of listed companies have published some form of climate commitment, also little changed year over year.
Share of listed companies with disclosed climate targets by target type
Source: MSCI Sustainability & Climate Research, data as of June 30, 2026. Note that totals are cumulative. The share of corporate climate targets reported here reflects the relevant share of all companies in the MSCI ACWI IMI.
Are companies on track to meet global climate goals?
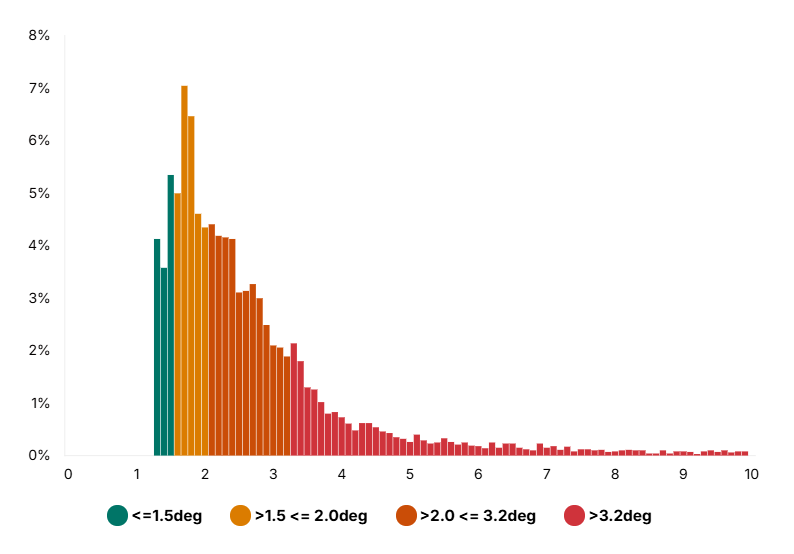
- The emissions trajectories of the world’s listed companies imply warming of 3°C (5.4°F) above preindustrial levels this century.3
- Thirteen percent of listed companies align with projected warming of 1.5°C (2.7°F) or less, while an additional 24% align with warming between 1.5°C and 2°C (3.6°F). Sixty-three percent of companies are on an emissions trajectory that would breach the 2°C threshold, including 28% whose trajectories would exceed 3.2°C (5.8°F).
- Our extrapolation relies on MSCI’s Implied Temperature Rise, a forward-looking climate-impact metric that institutional investors use to assess the alignment of portfolios with global climate goals.
Projected temperature alignment of the world’s listed companies (Implied Temperature Rise in °C)
Source: MSCI Sustainability and Climate Research, data as of March 31, 2026. Not index weighted. The dataset used in this estimate comprises roughly 95% of MSCI ACWI IMI constituents, as roughly 5% of constituents lack data that would allow us to compute the relevant measures.
% of companies by ITR band
How much are companies investing in carbon credits?
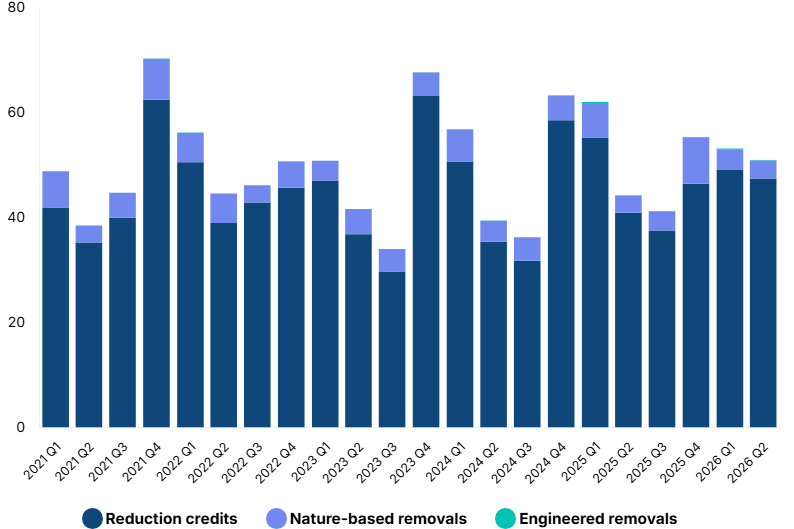
- Companies retired 35 MtCO2e of carbon credits in the third quarter, down 15% from the same period last year. Credit retirement removes credits from circulation once emissions reductions are claimed, indicating demand.
- Emissions-reduction projects accounted for 94% of Q3 retirements. Removal credits made up the remainder, the vast majority of which were nature-based. Engineered removals represented less than 1% of total retirements but are now recurring, reflecting delivery of direct-air capture and biochar projects under contract.
- Corpay, Inc. led the top 10 companies by carbon-credit retirements in the third quarter, retiring 2.3 MtCO2e of credits. Just over half (54%) came from REDD+ projects, with the remainder split evenly between renewable-energy (23%) and energy-efficiency (23%) projects. The other companies in the top 10, in descending order, were Organización Terpel S.A., Yamato Holdings Co., Ltd., Primax Colombia, Engie SA, Lenovo Group Limited, PricewaterhouseCoopers (PwC), Poste Italiane S.p.A., Traxys S.à r.l. and Salesforce, Inc.
Amount of carbon credit retirements disclosed quarterly, by type (MtCO2e)
Source: MSCI Carbon Markets, data as of Dec. 31, 2025, based on data from ACR, ART, BioCarbon, CAR, Cercarbono, Climate Forward, CDM (NDC eligible credits only), GCC, Gold Standard, Plan Vivo, Puro Earth and Verra.
What do corporate purchasing commitments signal about future demand for carbon credits?
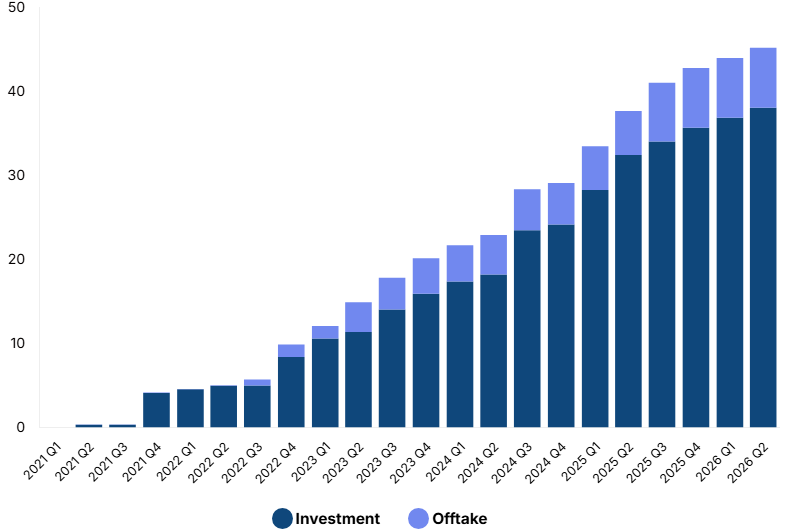
- Investment in carbon-credit projects and offtake agreements reached a cumulative USD 47.5 billion by the third quarter of 2026, according to public announcements tracked by MSCI Carbon Markets. Investment — capital flowing to project developers and platforms — accounts for USD 40.3 billion of the total, while offtake agreements — contractual commitments to buy credits from specific projects — account for USD 7.2 billion.
- Offtake agreements made up 15% of the cumulative total in the third quarter of 2026, down from a peak of about 24% in the second quarter of 2023. Since the end of 2022, cumulative offtake value has grown about five-fold, from USD 1.5 billion to USD 7.2 billion, while investment has grown similarly, from USD 8.4 billion to USD 40.3 billion. Buyers are contracting future supply ahead of anticipated market growth, particularly for engineered CO2 removals such as direct air capture and biochar.
- Although the market remains small relative to the scale needed to support net-zero pathways, the trajectory is significant. Because offtake agreements are forward-looking contractual commitments, the cumulative value announced to date may provide an early indication of physical delivery volumes expected between now and delivery years such as 2030 and 2035.
Cumulative carbon-credit investment and offtake transactions (USD bn 2021 – Q2 2026)
Source: MSCI Carbon Markets, based on data as of June 30, 2026. All data sourced from public announcements of offtakes and investments. “Offtake” represents contractual agreements to buy carbon credits and follows a range of deal structures. ‘Investment” includes financial capital flows into entities or initiatives involved in generating carbon credits. Chart shows cumulative deal value in USD billions, aggregated by transaction quarter.
References
- Significantly, the model does not consider emissions from the production of imported energy (Scope 2) or emissions from imported goods or services (Scope 3).
- “Countries and regions,” International Energy Agency, available at iea.org.
- See “Sovereign Bonds and Country Pathways,” Institutional Investors Group on Climate Change, April 2024. For a summary of literature on the topic of fair-share budgets, see “Fair share,” Climate Action Tracker, available atclimateactiontracker.org.
- The month marked Western Europe’s hottest June on record. See, “Surface Air Temperature for June 2026,” Copernicus Climate Change Service, July 9, 2026.
- See, e.g., “Europe’s heatwave curbs French nuclear plants,” Reuters, June 24, 2026.
- See “Europe’s extreme heat is shutting down power plants,” MIT Technology Review, June 24, 2026 and “2025 Universal Registration Document, including the Annual Financial Report,” EDF.
- Based on their aggregate emissions, sector-specific carbon budgets and climate targets as of June 30, 2026.