How do football’s semifinalists compare on climate?
- The emissions trajectories of the countries represented in the semifinals imply average warming of 2°C above preindustrial levels this century, meaning the group broadly aligns with the goals of the Paris Agreement, which seeks to limit the rise in average global temperatures to well below that threshold.
- They range from 1.9°C in France to 2.1°C in Spain, based on MSCI’s Sovereign Implied Temperature Rise model, which considers GHG emissions produced within a country’s borders.1Significantly, the model does not consider emissions from the production of imported energy (Scope 2) or emissions from imported goods or services (Scope 3). (We use climate metrics for the whole of the U.K. rather than just England, as climate policy takes place at the national level.)
- The semifinalists differ in the share of low-carbon energy supply (nuclear and renewables) in their energy systems. Low-carbon sources account for 58% of France’s energy supply (driven by nuclear), 33% in Spain, 24% in the U.K. and 15% in Argentina, according to the International Energy Agency.2“Countries and regions,” International Energy Agency, available at iea.org. These figures describe each country’s current energy mix and are distinct from MSCI’s Implied Temperature Rise estimates, which incorporate decarbonization targets, domestic policies and remaining carbon budgets through a fair-share methodology.3See “Sovereign Bonds and Country Pathways,” Institutional Investors Group on Climate Change, April 2024. For a summary of literature on the topic of fair-share budgets, see “Fair share,” Climate Action Tracker, available atclimateactiontracker.org.
Comparing the semifinalists on climate and energy
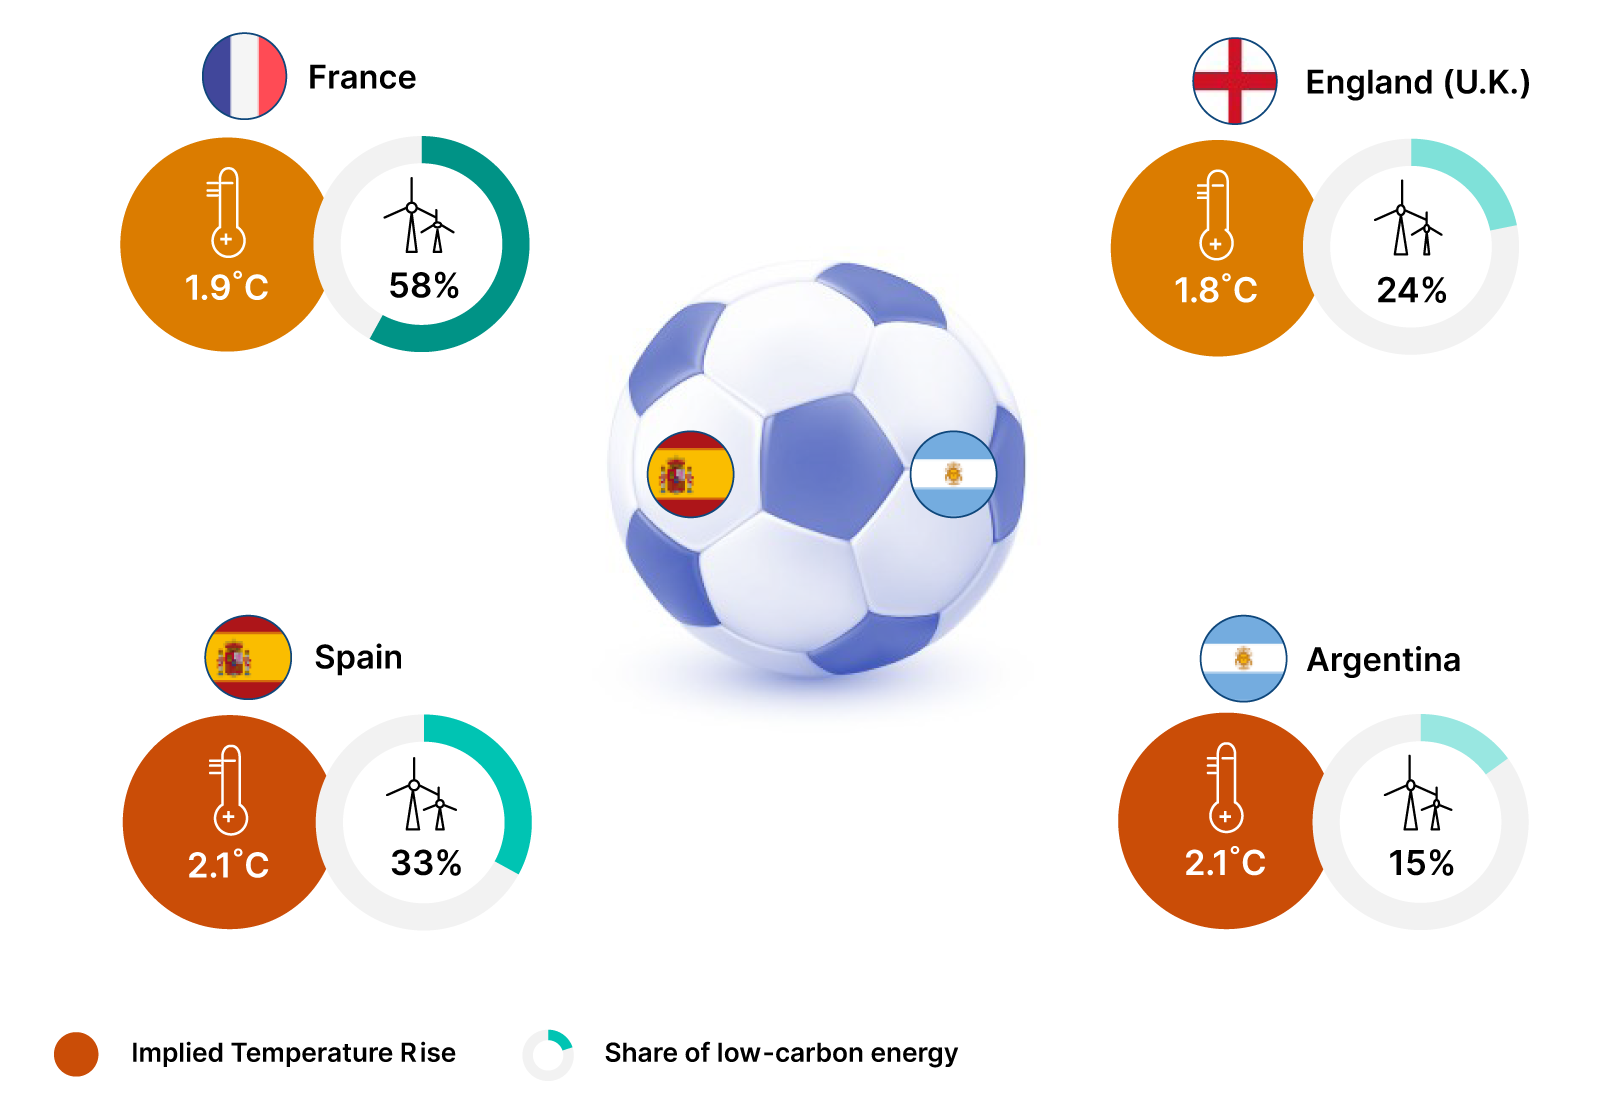
Source: MSCI Sustainability & Climate Research, data as of June 30, 2026. Energy-supply data from the International Energy Agency, latest available year (2024).
How vulnerable are European power prices to extreme heat?
- Average daily temperatures soared across western Europe in June, as did wholesale electricity prices in key markets. Day-ahead prices averaged about €105/MWh in France and €133/MWh in Germany from June 17 to 26, more than a third above the same-week average in 2023 and 2024. A comparable late-June heat wave in 2025 also drove prices higher.4The month marked Western Europe’s hottest June on record. See, “Surface Air Temperature for June 2026,” Copernicus Climate Change Service, July 9, 2026.
- Hotter weather increases demand for air conditioning, particularly in offices and dense urban areas. At the same time, thermal power plants and solar photovoltaic systems become less efficient as temperatures rise. Cooling systems become less effective, and river-water temperatures can reach regulatory limits, forcing some nuclear, gas and coal plants to reduce output.5See, e.g., “Europe’s heatwave curbs French nuclear plants,” Reuters, June 24, 2026.
- Because Europe’s day-ahead electricity markets are closely interconnected, price shocks can spread across borders within hours. If hotter summers become more frequent, extreme heat could become an increasingly important driver of seasonal electricity prices. Maintaining reliable electricity supplies may also require significant investment in climate adaptation. French nuclear utility EDF, for example, is expected to spend about USD 680 million (€600 million) a year on adaptation-related upgrades over the next 15 years.6See “Europe’s extreme heat is shutting down power plants,” MIT Technology Review, June 24, 2026 and “2025 Universal Registration Document, including the Annual Financial Report,” EDF.
Day-ahead wholesale price and country-average daily temperature – June 2026
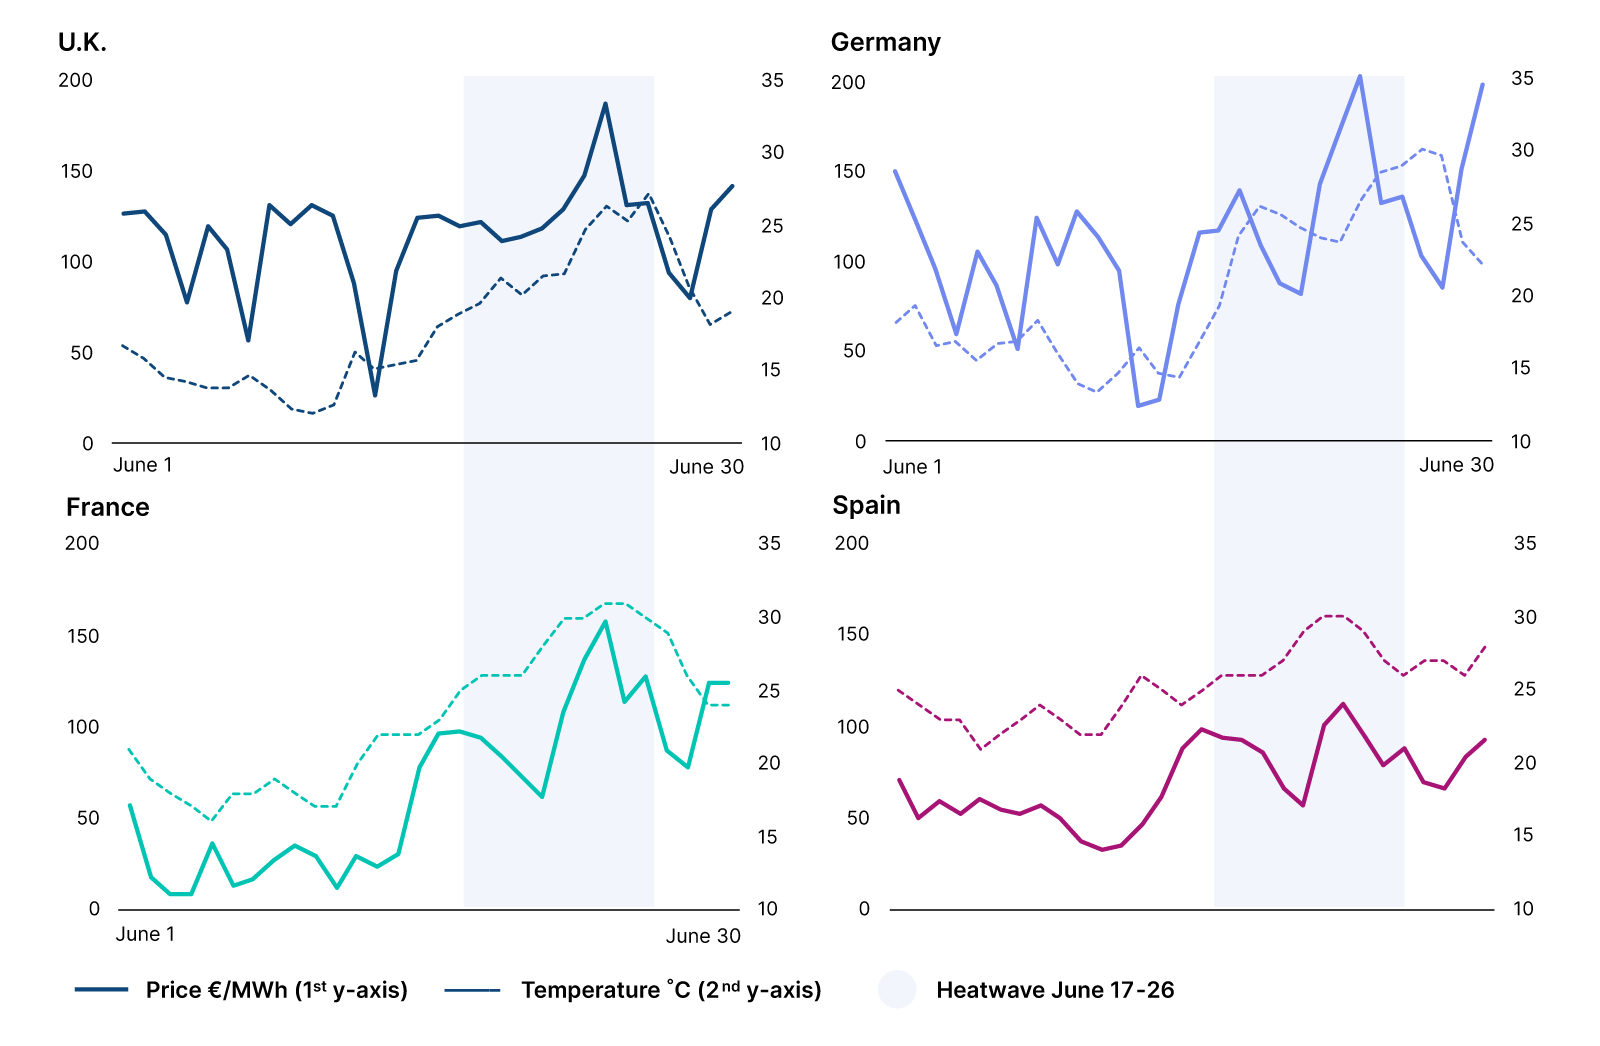
Source: MSCI Sustainability & Climate Research, July 2026, based on day-ahead wholesale electricity prices from Ember’s European Wholesale Electricity Price Data (derived from ENTSO-E), reported in EUR/MWh (with U.K. prices converted from GBP to euros). Country temperatures are daily mean air temperature from ERA5 reanalysis (via Open-Meteo), population-weighted across the 20 most-populous cities of each country (mainland Spain only), for June 2026.
How have climate funds performed?
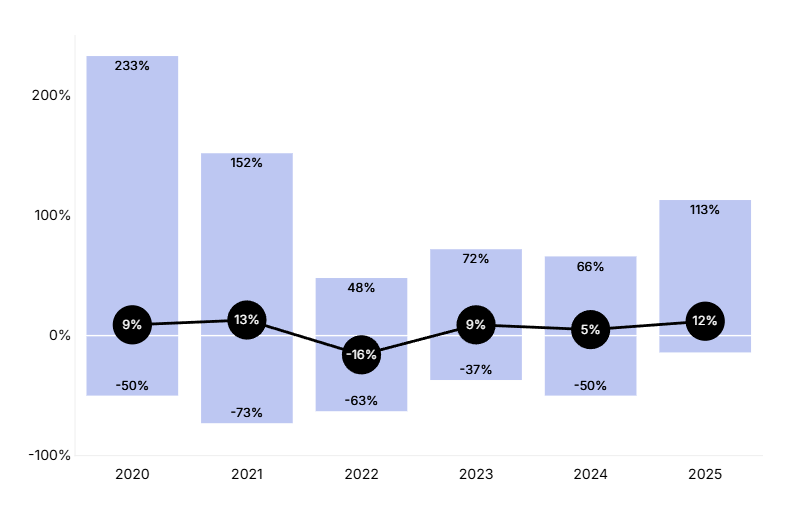
- Listed climate-themed funds posted a median return of 8.3% in the three months ended June 30, 2026.
- Total assets reached USD 710 billion in the second quarter, up 8.9% since the start of the year. Most of the increase (88%) came from gains in the value of existing investments, while the remainder reflected new money flowing into the funds. Returns were strongest among funds focused on energy-transition technologies, as investors favored companies building clean-energy infrastructure and related technologies.
- In addition to the listed universe, there were about 235 climate-themed private-capital funds globally, with combined capitalization of about USD 171.2 billion as of March 31, 2026.
Publicly traded climate funds (distribution of calendar year returns)
Source: MSCI Sustainability & Climate Research and MSCI Private Capital Universe. Public funds data as of March 31, 2026. Public funds include equity, fixed income, and multi-asset ETFs and mutual funds. Private funds include private equity, private credit, and private real assets funds.
Capital in climate funds (USD billion)
Public climate funds (cumulative capital raised)
Source: MSCI Sustainability & Climate Research, data as of June 30, 2026.
Private climate funds (cumulative capital raised)
Source: MSCI Private Capital Universe, data as of March 31, 2026. Private funds include private equity, private credit and private real-assets funds.
What percentage of companies have set climate targets?
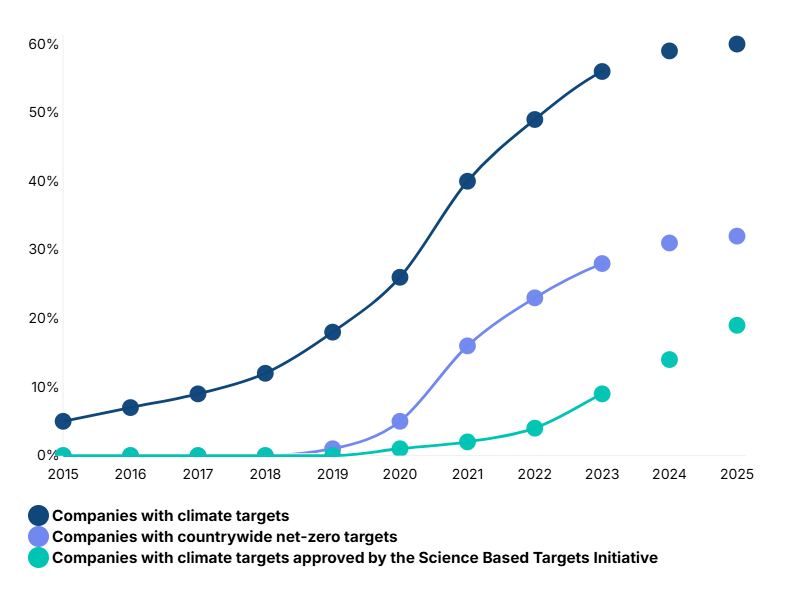
- Roughly one-fifth (20%) of listed companies had a climate target validated by the Science Based Targets initiative (SBTi) as of June 30, 2026, up from 18% a year earlier. SBTi-approved targets are widely regarded as a mark of credibility because the initiative assesses whether targets align with climate science.
- Both the ambition and rigor of corporate targets vary widely. Just over a third (34%) of companies have set a net-zero emissions target, though not necessarily one validated by the SBTi, roughly unchanged from a year earlier. Overall, 61% of listed companies have published some form of climate commitment, also little changed year over year.
Share of listed companies with disclosed climate targets by target type
Source: MSCI Sustainability & Climate Research, data as of June 30, 2026. Note that totals are cumulative. The share of corporate climate targets reported here reflects the relevant share of all companies in the MSCI ACWI IMI.
Are companies on track to meet global climate goals?
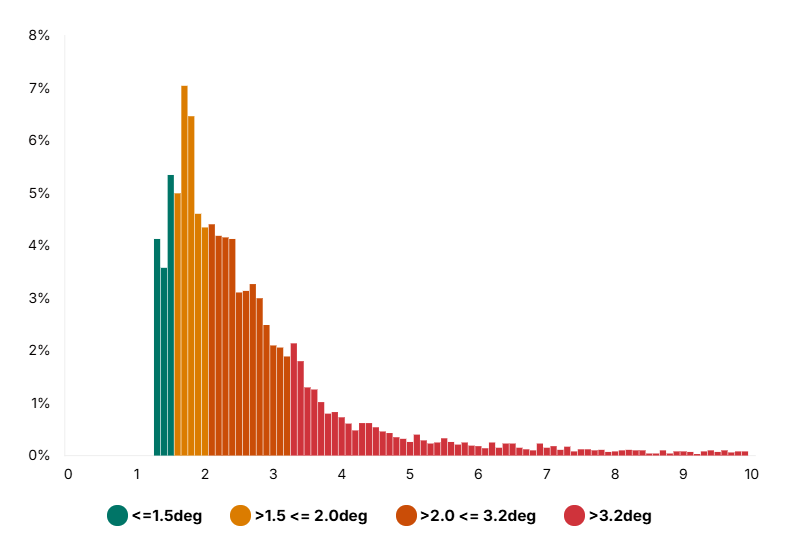
- The emissions trajectories of the world’s listed companies imply warming of 3°C (5.4°F) above preindustrial levels this century.7Based on their aggregate emissions, sector-specific carbon budgets and climate targets as of June 30, 2026.
- Twelve percent of listed companies align with projected warming of 1.5°C (2.7°F) or less, while an additional 25% align with warming between 1.5°C and 2°C (3.6°F). Sixty-four percent of companies are on an emissions trajectory that would breach the 2°C threshold, including 29% whose trajectories would exceed 3.2°C (5.8°F).
- Our extrapolation relies on MSCI’s Implied Temperature Rise, a forward-looking climate-impact metric that institutional investors use to assess the alignment of portfolios with global climate goals.
Projected temperature alignment of the world’s listed companies (Implied Temperature Rise in °C)
Source: MSCI Sustainability and Climate Research, data as of March 31, 2026. Not index weighted. The dataset used in this estimate comprises roughly 95% of MSCI ACWI IMI constituents, as roughly 5% of constituents lack data that would allow us to compute the relevant measures.
% of companies by ITR band
How much are companies investing in carbon credits?
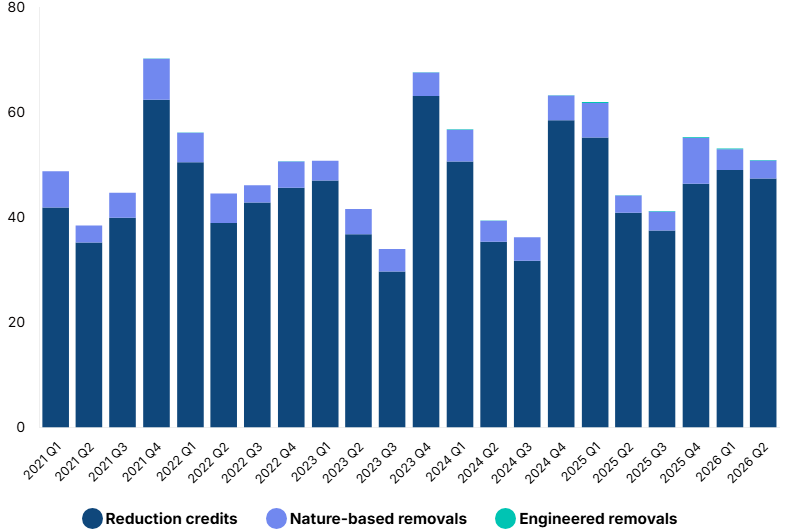
- Companies retired 51 MtCO2e of carbon credits in the second quarter, up 15% from the same period last year. Credit retirement removes credits from circulation once emissions reductions are claimed, indicating demand.
- Emissions-reduction projects accounted for 93% of Q2 retirements. Removal credits made up the remainder, the vast majority of which were nature-based. Engineered removals represented less than 1% of total retirements but are now recurring, reflecting delivery of direct-air capture and biochar projects under contract.
- Hess led the top 10 companies by carbon-credit retirements in the second quarter, retiring 12.5 MtCO2e of credits from the Guyana JREDD+ project. The remaining companies, in descending order, were Organización Terpel S.A., Netflix, Inc., CMA CGM S.A., Lenovo Group Limited, VistaJet, Cementos Argos S.A., Biomax Biocombustibles S.A., Petróleos del Milenio (Grupo Petromil), and Natura Cosméticos.
Amount of carbon credit retirements disclosed quarterly, by type (MtCO2e)
Source: MSCI Carbon Markets, data as of Dec. 31, 2025, based on data from ACR, ART, BioCarbon, CAR, Cercarbono, Climate Forward, CDM (NDC eligible credits only), GCC, Gold Standard, Plan Vivo, Puro Earth and Verra.
What do corporate purchasing commitments signal about future demand for carbon credits?
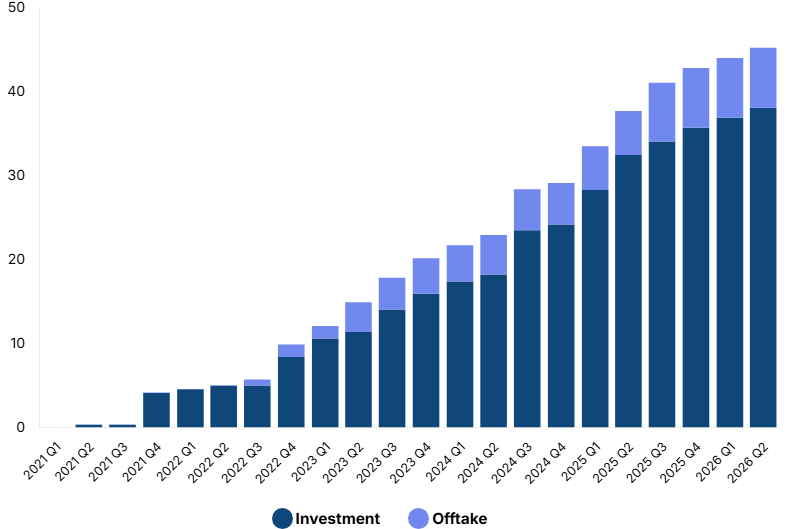
- Investment in carbon-credit projects and offtake agreements reached a cumulative USD 45.2 billion by the second quarter of 2026, according to public announcements tracked by MSCI Carbon Markets. Investment — capital flowing to project developers and platforms — accounts for USD 38.1 billion of the total, while offtake agreements — contractual commitments to buy credits from specific projects — account for more than USD 7 billion.
- The growing share of offtake agreements reflects increasing corporate demand to secure future supply ahead of anticipated market growth, particularly for engineered CO2 removals such as direct air capture and biochar. The cumulative value of announced offtake agreements has grown to about USD 7 billion, a roughly 15-fold increase since 2022. Over the same period, cumulative investment grew about eight-fold.
- Although the market remains small relative to the scale needed to support net-zero pathways, the trajectory is significant. Because offtake agreements are forward-looking contractual commitments, the cumulative value announced to date may provide an early indication of physical delivery volumes between now and delivery years such as 2030 and 2035.
Cumulative carbon-credit investment and offtake transactions (USD bn 2021 – Q2 2026)
Source: MSCI Carbon Markets, based on data as of June 30, 2026. All data sourced from public announcements of offtakes and investments. “Offtake” represents contractual agreements to buy carbon credits and follows a range of deal structures. ‘Investment” includes financial capital flows into entities or initiatives involved in generating carbon credits. Chart shows cumulative deal value in USD billions, aggregated by transaction quarter.
References
- Significantly, the model does not consider emissions from the production of imported energy (Scope 2) or emissions from imported goods or services (Scope 3).
- “Countries and regions,” International Energy Agency, available at iea.org.
- See “Sovereign Bonds and Country Pathways,” Institutional Investors Group on Climate Change, April 2024. For a summary of literature on the topic of fair-share budgets, see “Fair share,” Climate Action Tracker, available atclimateactiontracker.org.
- The month marked Western Europe’s hottest June on record. See, “Surface Air Temperature for June 2026,” Copernicus Climate Change Service, July 9, 2026.
- See, e.g., “Europe’s heatwave curbs French nuclear plants,” Reuters, June 24, 2026.
- See “Europe’s extreme heat is shutting down power plants,” MIT Technology Review, June 24, 2026 and “2025 Universal Registration Document, including the Annual Financial Report,” EDF.
- Based on their aggregate emissions, sector-specific carbon budgets and climate targets as of June 30, 2026.