At America’s 250th birthday, the MSCI Institute is looking at how the world’s largest financial market has developed and continues to evolve — through the lens of global equity markets.
The charts that follow tell part of that story. We trace U.S. stock performance across the past century, show how the U.S. share of global equity has changed over the past 30 years, and track which companies have held the title of most valuable at different points in time.
What the data shows is not a static picture. Markets realign. Economies that once seemed peripheral move to the center. The U.S. itself, after all, was once an emerging market.
HIGHLIGHTS
What would $100 invested in U.S. equities a century ago be worth today?
A century of U.S. markets turned $100 into $1.7 million. That 17,000-fold increase is the power of compounding — and it survived the Great Depression, two world wars, multiple recessions, a global financial crisis and a pandemic.
Growth of $100 invested in U.S. equities (1926-2026)
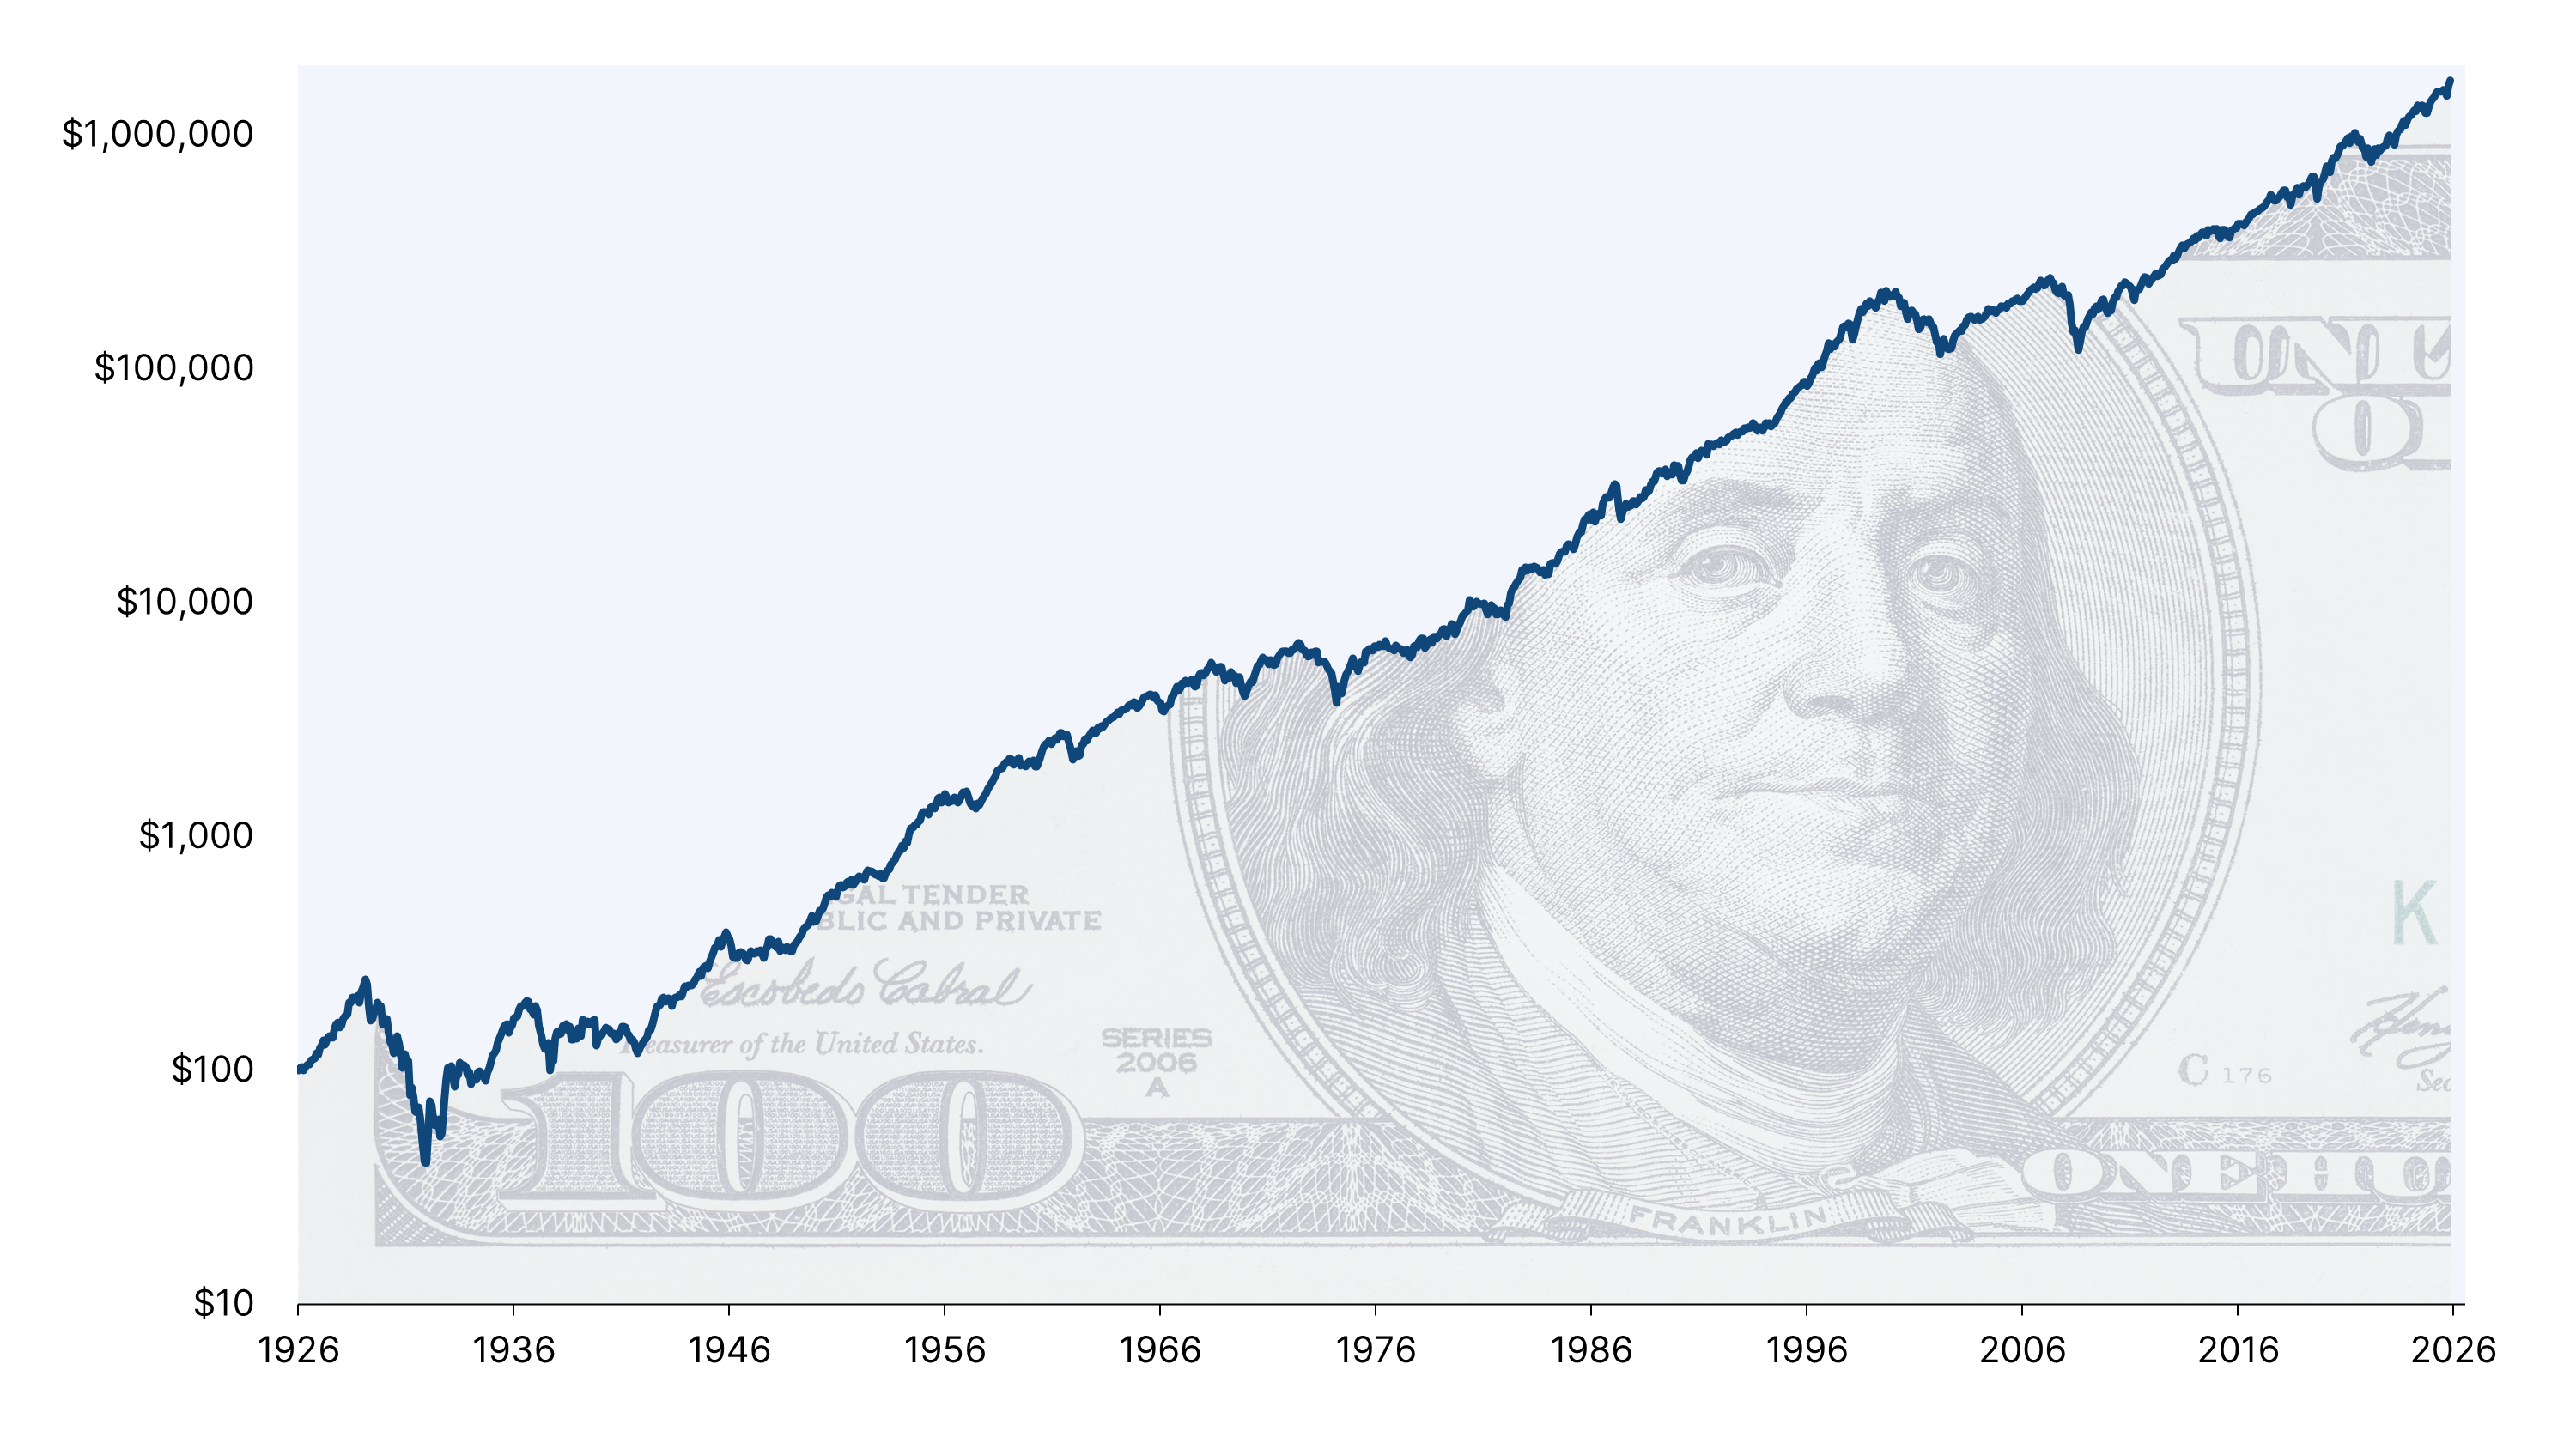
Source: MSCI Institute, based on data in the MSCI USA Index (December 1969–May 2026) and the Kenneth French Data Library (July 1926–November 1969). The two series join in December 1969 and should be treated as illustrative rather than a single continuous index. Returns are gross total return in USD with dividends reinvested and are nominal. No taxes, transaction costs or fees have been deducted. A logarithmic scale is used so that equal vertical distances represent equal proportional gains.
How has the U.S. share of global developed-market equities changed over time?
The U.S. has gone from representing less than half of developed-market equity value to nearly three quarters. The U.S. accounted for 44% of the MSCI World Index in 1997. By April 2026, that share had reached 73%. An investor who thought they were diversifying globally in 1997 would barely recognize what that means today.
U.S. weight in the MSCI World Index (%)
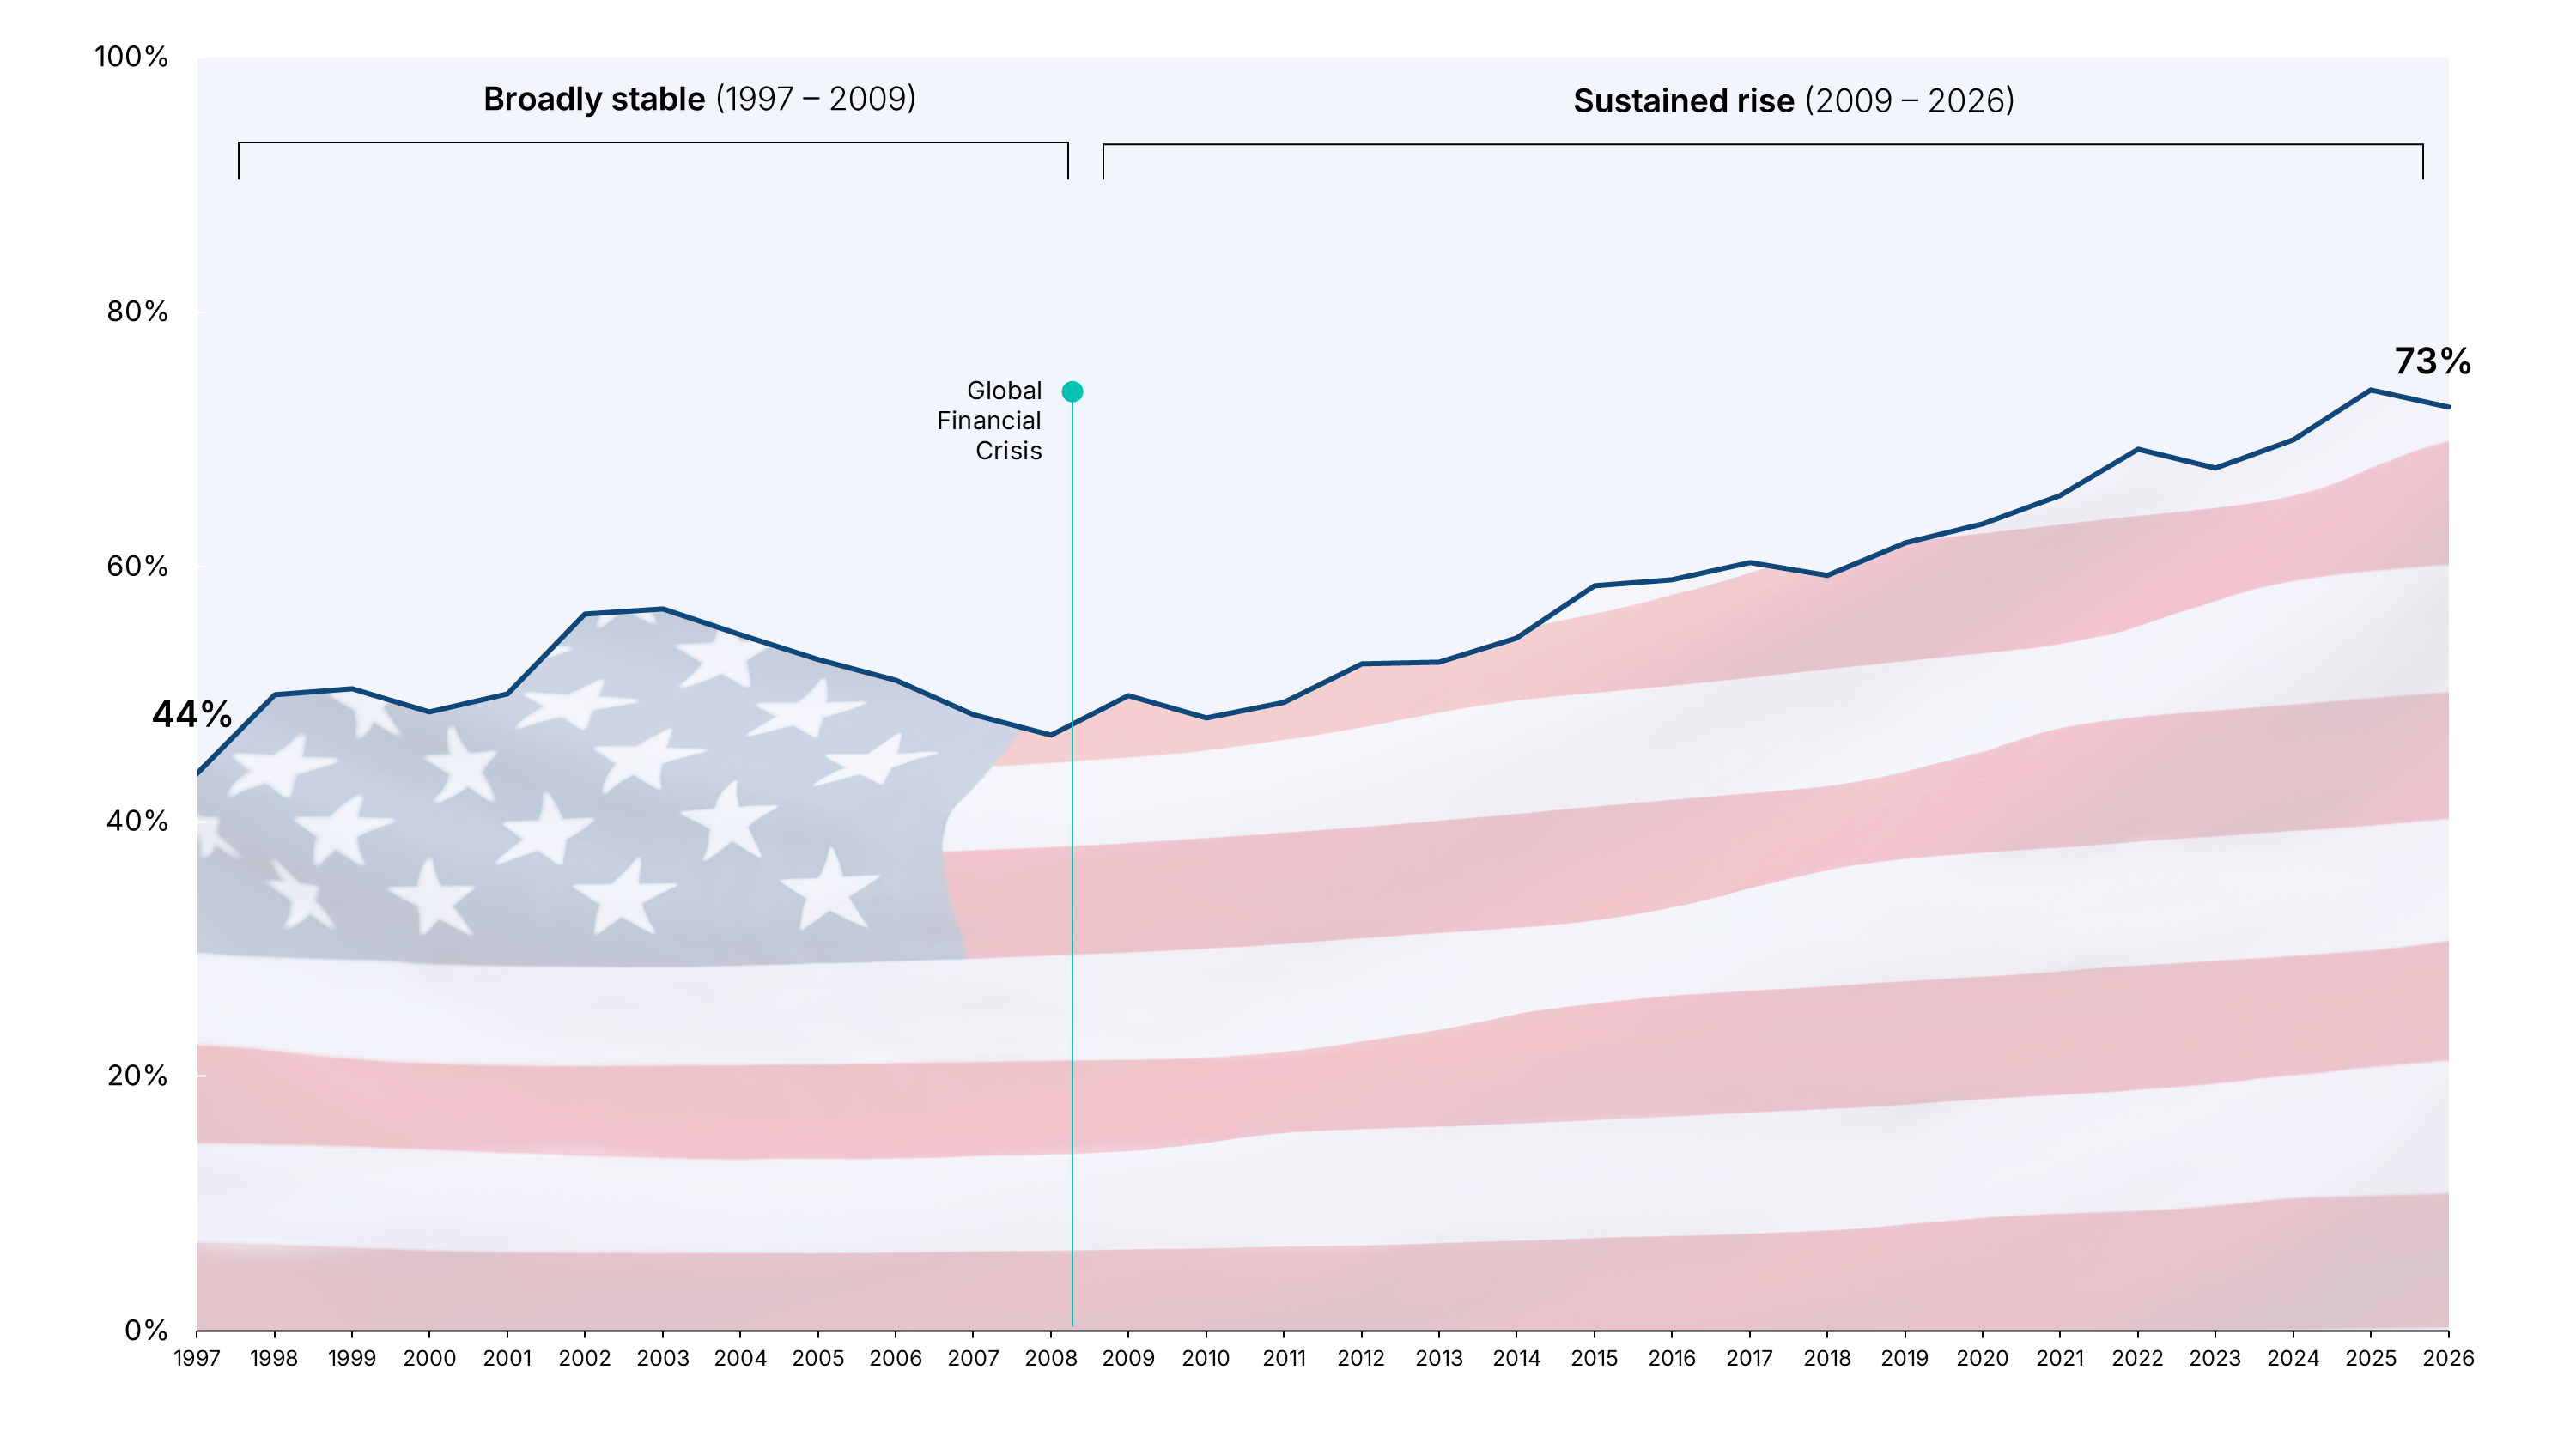
Source: MSCI Institute, based on MSCI index data. The chart shows the weight of the U.S. within the MSCI World Index, which comprises large- and mid-cap equities across 23 developed markets, at the first business day of each year from 1997 to 2025, and as of May 28, 2026. Countries and country weights reflect each market’s share of total free float-adjusted market capitalization within the index. World ex-USA weight is the residual.
Which companies have been America’s most valuable — and when?
America’s most valuable company has changed hands only four times in 25 years. General Electric dominated the early 2000s, Exxon Mobil held the position through the financial crisis, Apple held it for over a decade, and NVIDIA claimed it most recently. Four companies, a quarter century — corporate dominance at the top is rarer than it looks.
Market capitalization (USD trillions)
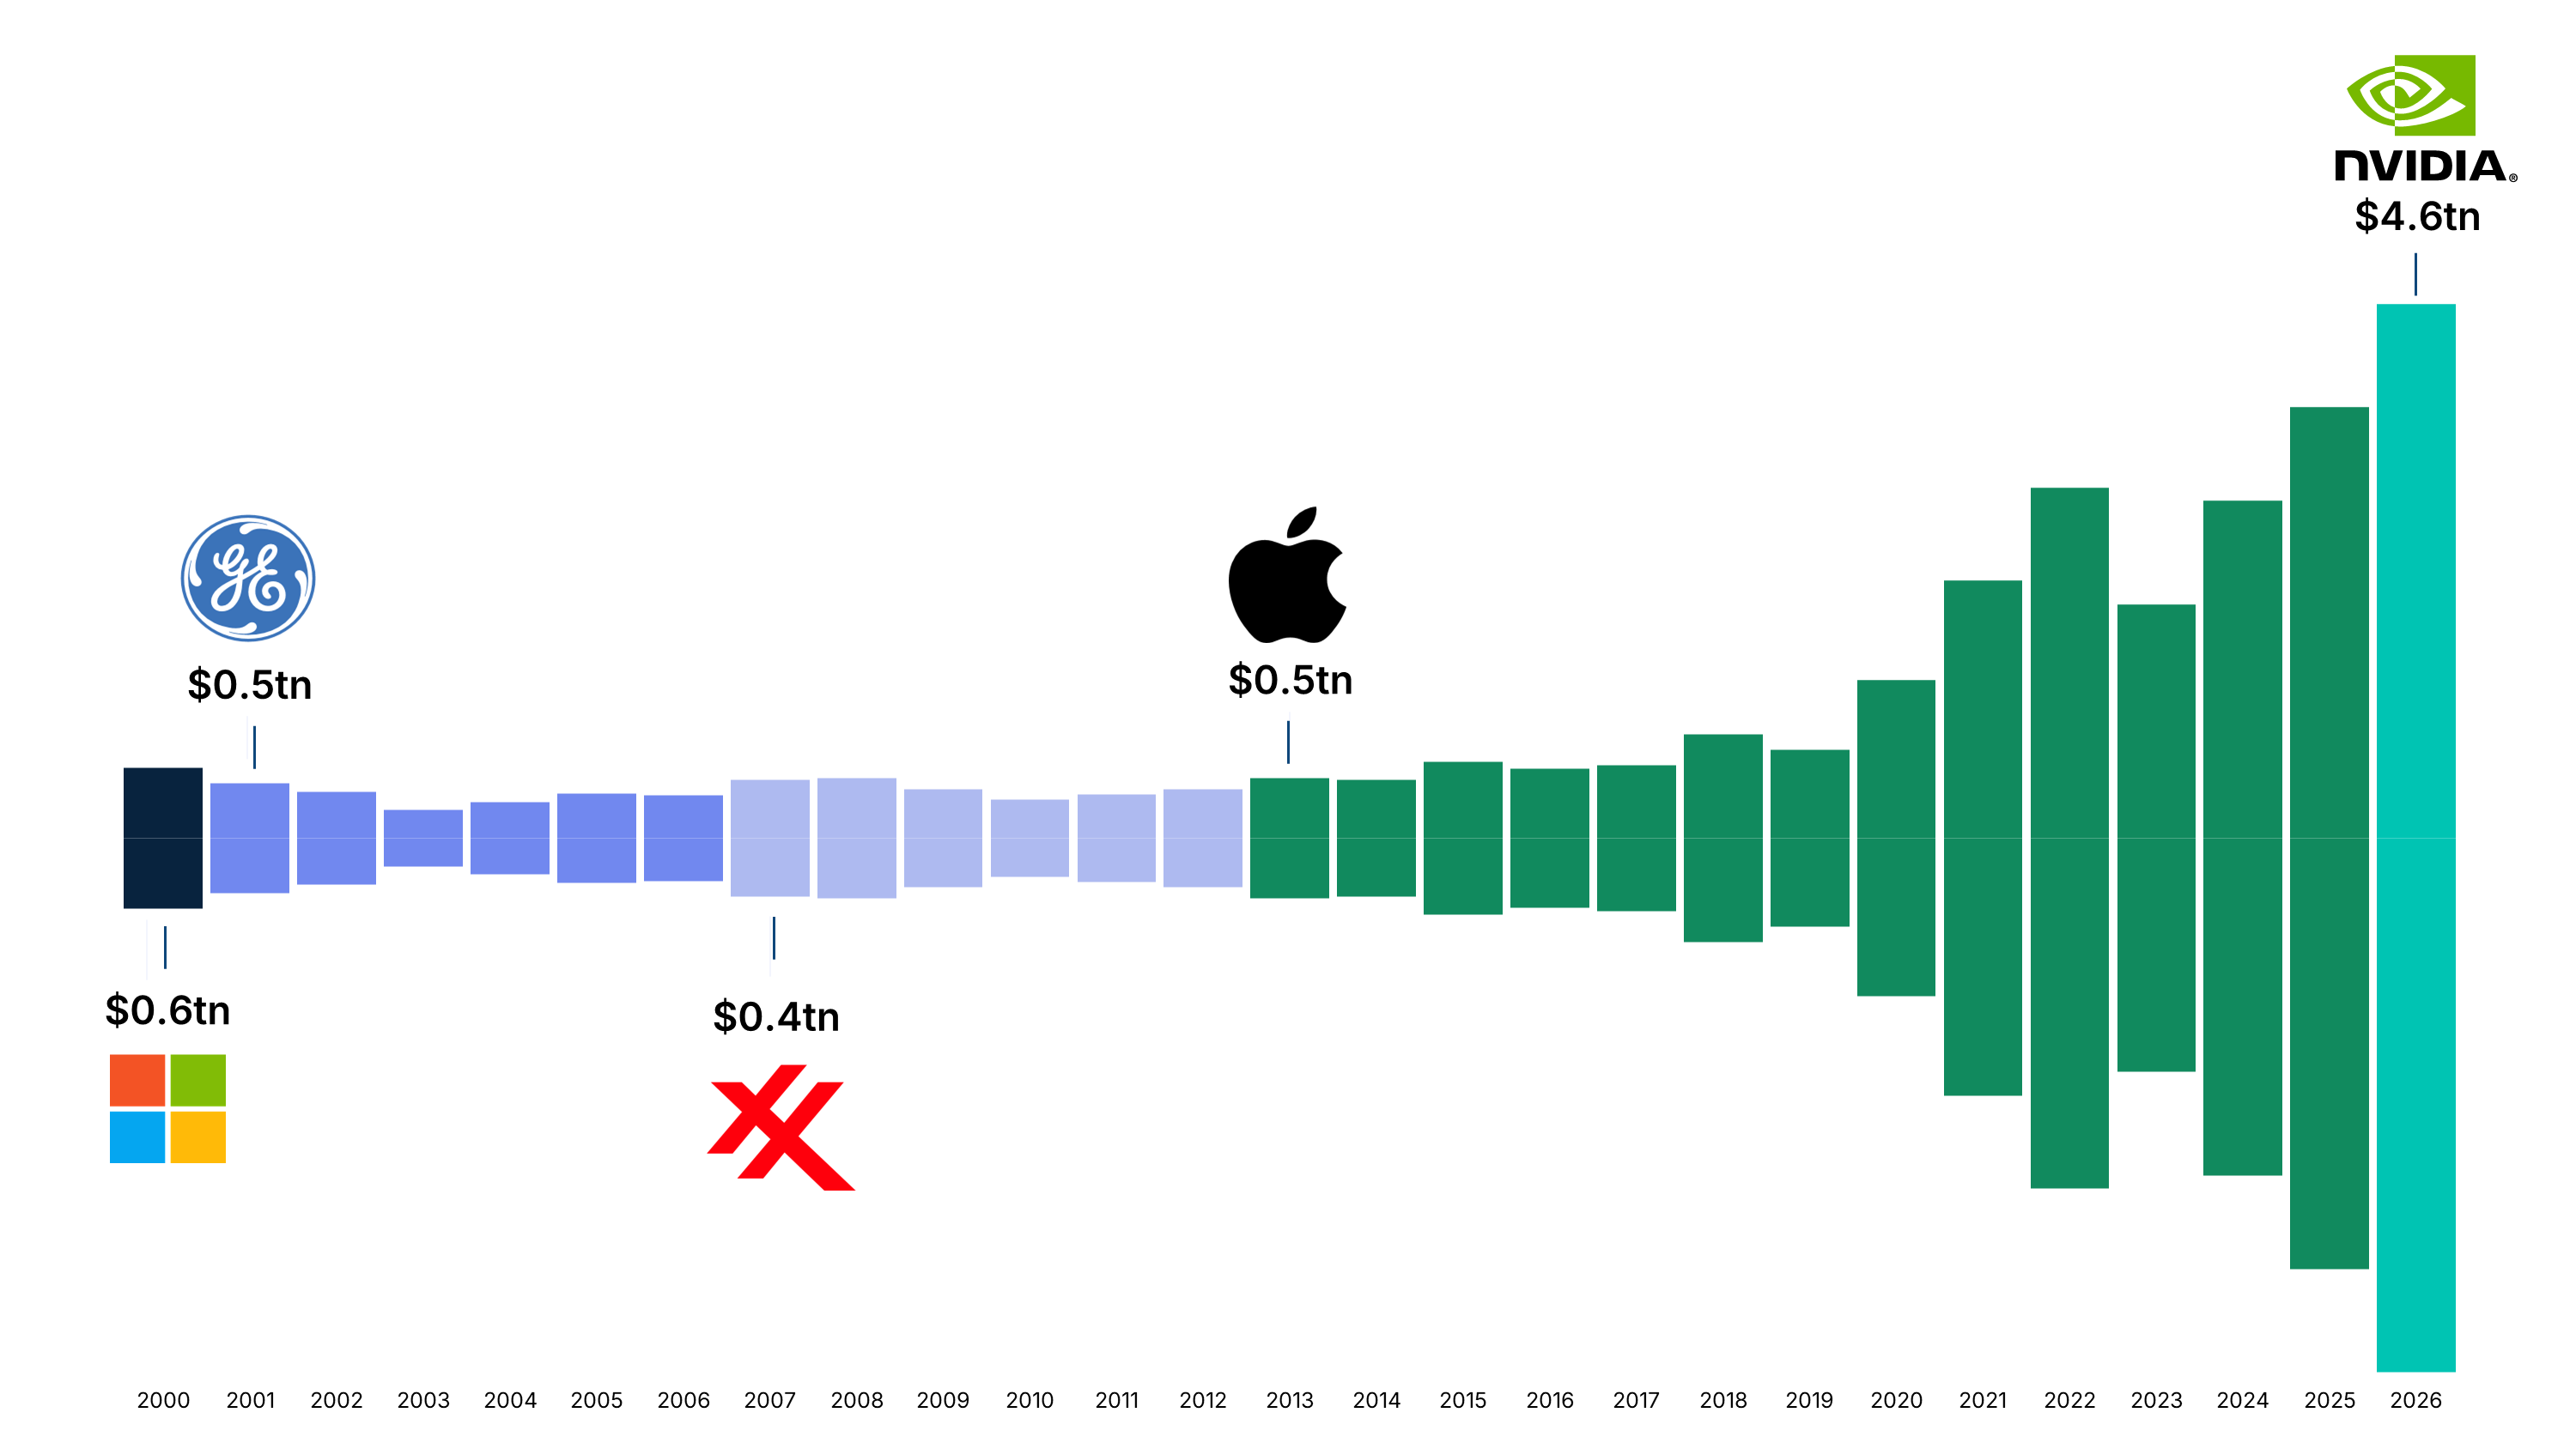
Source: MSCI Institute, based on MSCI index data. The chart shows the free float-adjusted market capitalization of the largest U.S. constituent of the MSCI USA Index at the first business day of each year from 2000 to 2026.