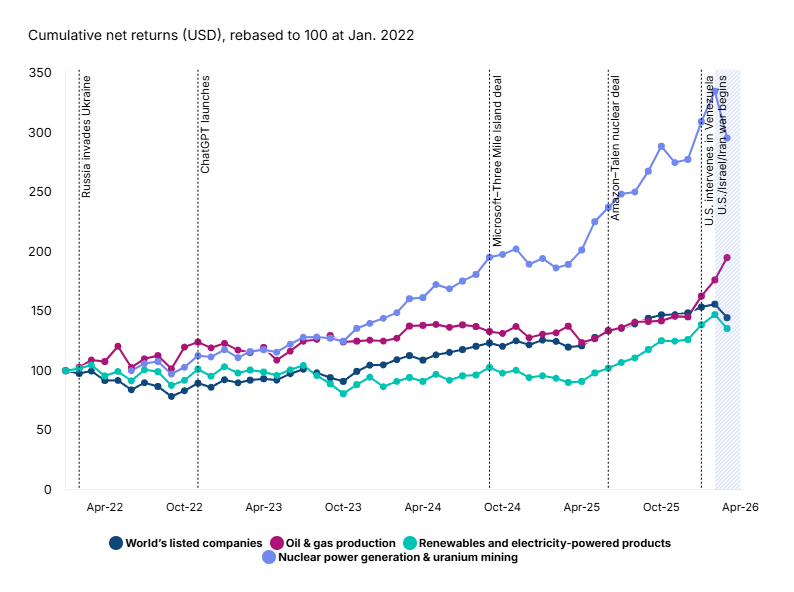
Four years of energy returns, redrawn by geopolitics and AI
- Energy markets pivoted sharply toward fossil fuels in March as supply disruptions in the Strait of Hormuz drove up prices. Between February 28 and March 31, shares of oil and gas companies rose around 11%, while clean-energy shares fell together with the rest of the aggregated stock market.
- The move marked a reversal from the past four years, when rising electricity demand lifted nuclear-linked equities nearly threefold and electricity-related companies – including EV manufacturers and pure-play renewables companies – by about 36%, despite policy headwinds in the U.S. The outperformance of nuclear over the period shown may also reflect markets pricing in long-term demand from AI data centers.
- Fossil fuels still supply roughly 80% of global energy, and shortages of oil and gas and their byproducts – from fertilizer to helium – have rippled across industries. While the shock may reinforce the long-term case for energy independence and renewables, it focused investors on the immediate upside for companies able to supply fossil fuels and increase free cash flows. Whether the rally also reflects a structural repricing of long-term fossil fuel demand remains an open question for investors.
Geopolitics and AI reshuffled the deck
Source: Data as of March 31, 2026. The chart reflects end-of-month index valuations. Nuclear power generation & uranium mining is represented by the MSCI ACWI IMI ex EM Small Cap Nuclear Power Generation & Uranium Mining Index. Renewables and clean technology are represented by the MSCI ACWI IMI Clean Energy Infrastructure Index. Oil & gas production is represented by the MSCI ACWI IMI Energy Index.
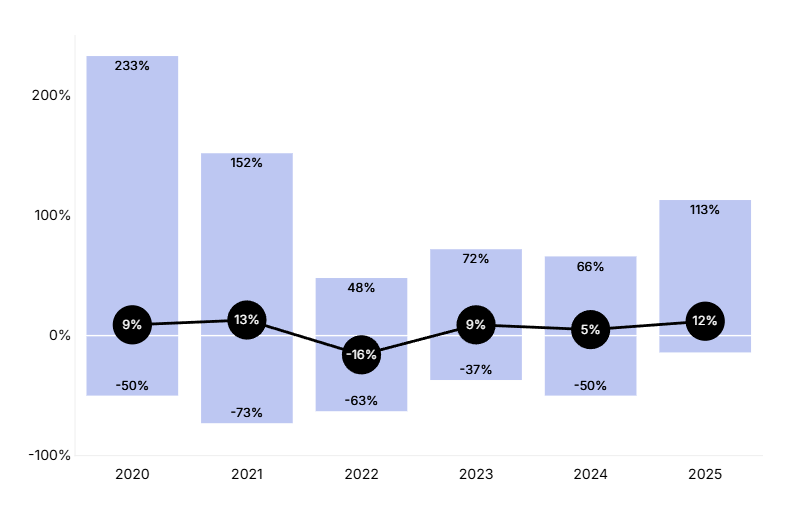
How have climate funds performed?
- Listed climate-themed funds had a median return of 8% in the three months ended March 31, 2026.
- Assets in listed climate-themed funds reached USD 662 billion in the first quarter, up 1.5% since the start of the year, driven largely by market performance in energy-transition funds, as stocks of diversified energy companies (including fossil-fuel companies transitioning their businesses) benefited from rising oil and gas prices.
- In addition to the listed universe, climate-named private-capital funds globally had combined capitalization of about USD 143 billion, as of Sept. 30, 2025.
Publicly traded climate funds (distribution of calendar year returns)
Source: MSCI Sustainability & Climate Research. Data from 2020 to 2025 represents calendar-year calculations. Data for Q1 2026 represents the three months ended March 31, 2026. Publicly traded funds include equity, fixed income and multi-asset exchange-traded and mutual funds.
Capital in climate funds (USD billion)
Private climate funds (cumulative capital raised)
Source: MSCI Sustainability & Climate Research, data as of March 31, 2026. Totals are cumulative.
Private climate funds (cumulative capital raised)
Source: MSCI Private Capital Universe, data as of Sept. 30, 2025. Private funds include private equity, private credit and private real-assets funds.
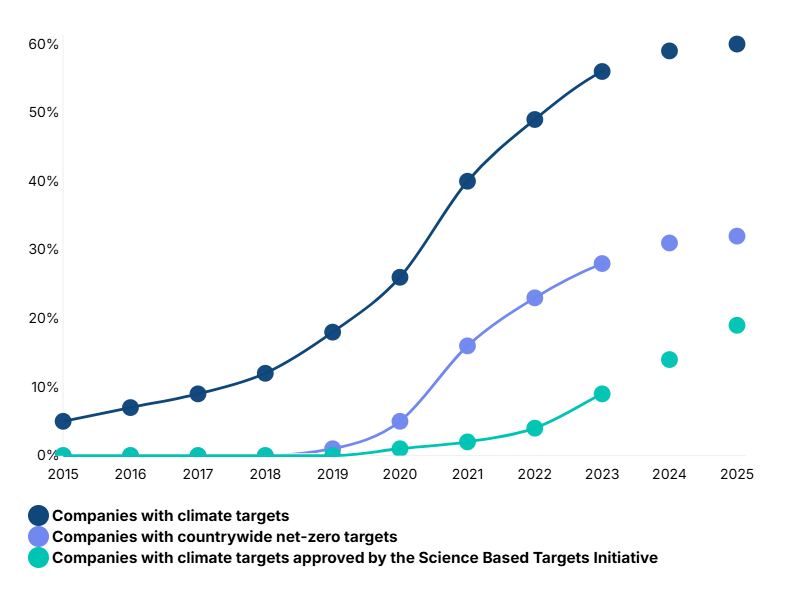
What percentage of companies have set climate targets?
- Nearly one-fifth (19%) of listed companies had a climate target validated by the Science Based Targets initiative (SBTi) as of March 31, 2026, up from 15% a year earlier, a notable acceleration compared with other types of climate targets. Many investors view SBTi-approved targets as a mark of credibility because the initiative assesses whether targets align with climate science.
- Both the ambition and rigor of corporate targets vary widely. Nearly a third (32%) of companies have set a net-zero emissions target, though not necessarily one validated by the SBTi, roughly unchanged from a year earlier. Overall, 58% of listed companies have published some form of climate commitment, also little changed year over year.
Share of listed companies with disclosed climate targets by target type
Source: MSCI Sustainability & Climate Research, data as of March 31, 2026. Note that totals are cumulative. The share of corporate climate targets reported here reflects the relevant share of all companies in the MSCI ACWI IMI.
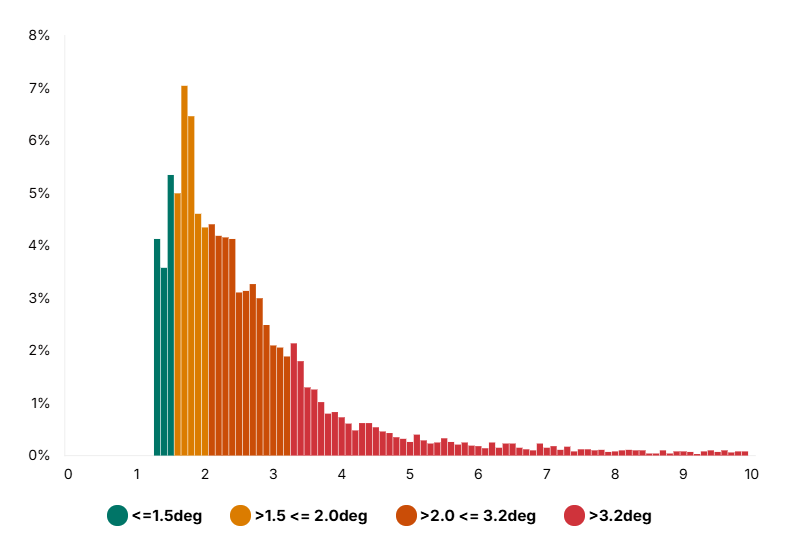
Are companies on track to meet global climate goals?
- The emissions trajectories of the world’s listed companies imply warming of 3°C (5.4°F) above preindustrial levels this century.[1]
- Twelve percent of listed companies aligned with projected warming of 1.5°C (2.7°F) or less, while an additional 25% aligned with warming between 1.5°C and 2°C (3.6°F). 62% of companies are on an emissions trajectory that would breach the 2°C threshold, including 27% whose trajectories would exceed 3.2°C (5.8°F).
- Our extrapolation relies on MSCI’s Implied Temperature Rise (ITR), a forward-looking climate-impact metric that institutional investors use to assess the alignment of portfolios with global climate goals.
Projected temperature alignment of the world’s listed companies (Implied Temperature Rise in °C)
Source: MSCI Sustainability and Climate Research, data as of March 31, 2026. Not index weighted. The dataset used in this estimate comprises roughly 95% of MSCI ACWI IMI constituents, as roughly 5% of constituents lack data that would allow us to compute the relevant measures.
% of companies by ITR band
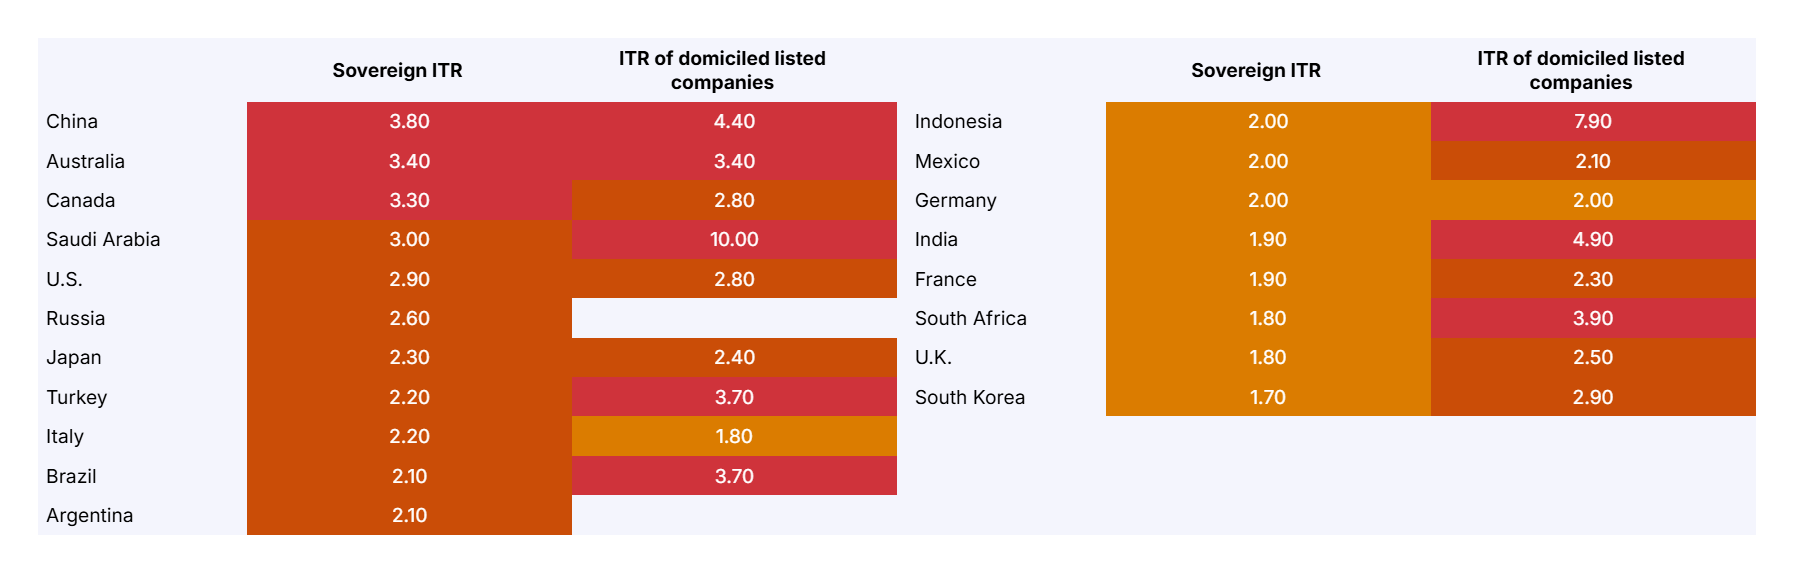
How do companies’ emissions trajectories compare with those of their home countries?
- Countries’ climate trajectories reflect differences in decarbonization targets, historical emissions, domestic policies and carbon budget constraints. We estimate the warming implied by those trajectories using MSCI’s Sovereign Implied Temperature Rise model, which considers GHG emissions produced within a country’s borders (Scope 1).[2]
- The model applies a fair-share approach, following recommendations from the Institutional Investors Group on Climate Change. This approach allocates proportionally larger carbon budgets to less-developed countries to balance decarbonization needs with economic development.[3]
- The table compares the warming trajectories of G20-member countries with those of the companies domiciled in them. Companies domiciled in many emerging markets, including Saudi Arabia, Indonesia and India, show higher estimated warming than their respective countries. This occurs because we estimate company emissions across all three scopes — including Scope 3 emissions from downstream activities like product use — many of which enter the atmosphere outside the company’s home country.
Projected temperature alignment of G20 countries versus listed companies based in each country (Implied Temperature Rise in ˚C)
Source: MSCI Sustainability & Climate Research, data as of March 31, 2026. The ITR of companies listed in Russia and Argentina is not shown because the securities of companies listed there are not included in the MSCI ACWI IMI.
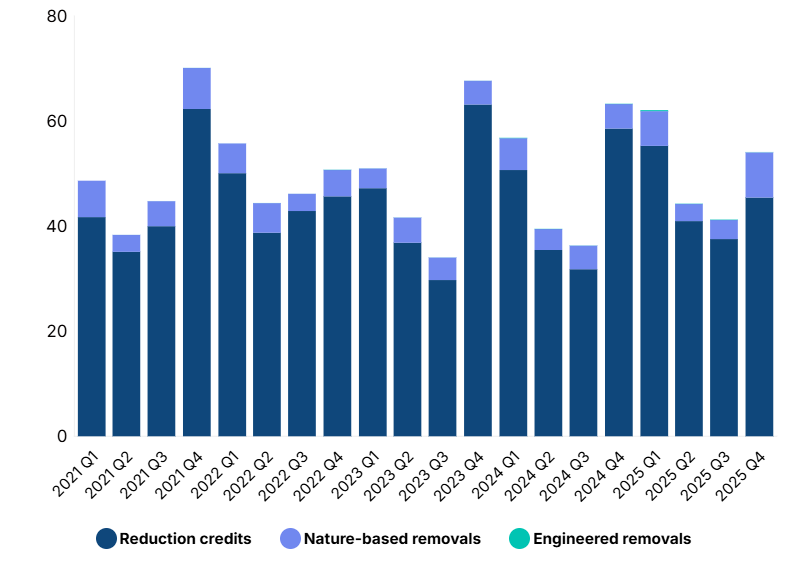
How much are companies investing in carbon credits?
- Companies retired 52.8 MtCO2e of carbon credits in the first quarter, down from 62.3 MtCO2e in the same period last year. Credit retirement removes credits from circulation once emissions reductions are claimed, indicating demand.
- Emissions-reduction projects accounted for 93% of Q1 retirements. Removal credits made up the remainder, the vast majority of which were nature-based; engineered removals represented less than 1% of total retirements.
- Energy major Eni, Colombian refiner Terpel and battery maker CATL retired the most carbon credits from the voluntary market in Q1.
Amount of carbon credit retirements disclosed quarterly, by type (MtCO2e)
Source: MSCI Carbon Markets, data as of March 31, 2026, based on data from ACR, ART, BioCarbon, CAR, Cercarbono, Climate Forward, CDM (NDC eligible credits only), GCC, Gold Standard, Plan Vivo, Puro Earth and Verra.
Largest credit retirees, Q1 2026 (tCO2e)
[1] Based on their aggregate emissions, sector-specific carbon budgets and climate targets as of March 31, 2026. Listed companies represented by the MSCI ACWI Investable Market Index (IMI), which includes large-, mid- and small-cap companies across 23 developed and 24 emerging market countries. As of March 31, 2026, the index comprises 8,253 companies and captures approximately 99% of the global equity investment opportunity set.
[2] Significantly, the model does not consider emissions from the production of imported energy (Scope 2) or emissions from imported goods or services (Scope 3).
[3] See “Sovereign Bonds and Country Pathways,” Institutional Investors Group on Climate Change, April 2024. For a summary of literature on the topic of fair-share budgets, see “Fair share,” Climate Action Tracker, available atclimateactiontracker.org.